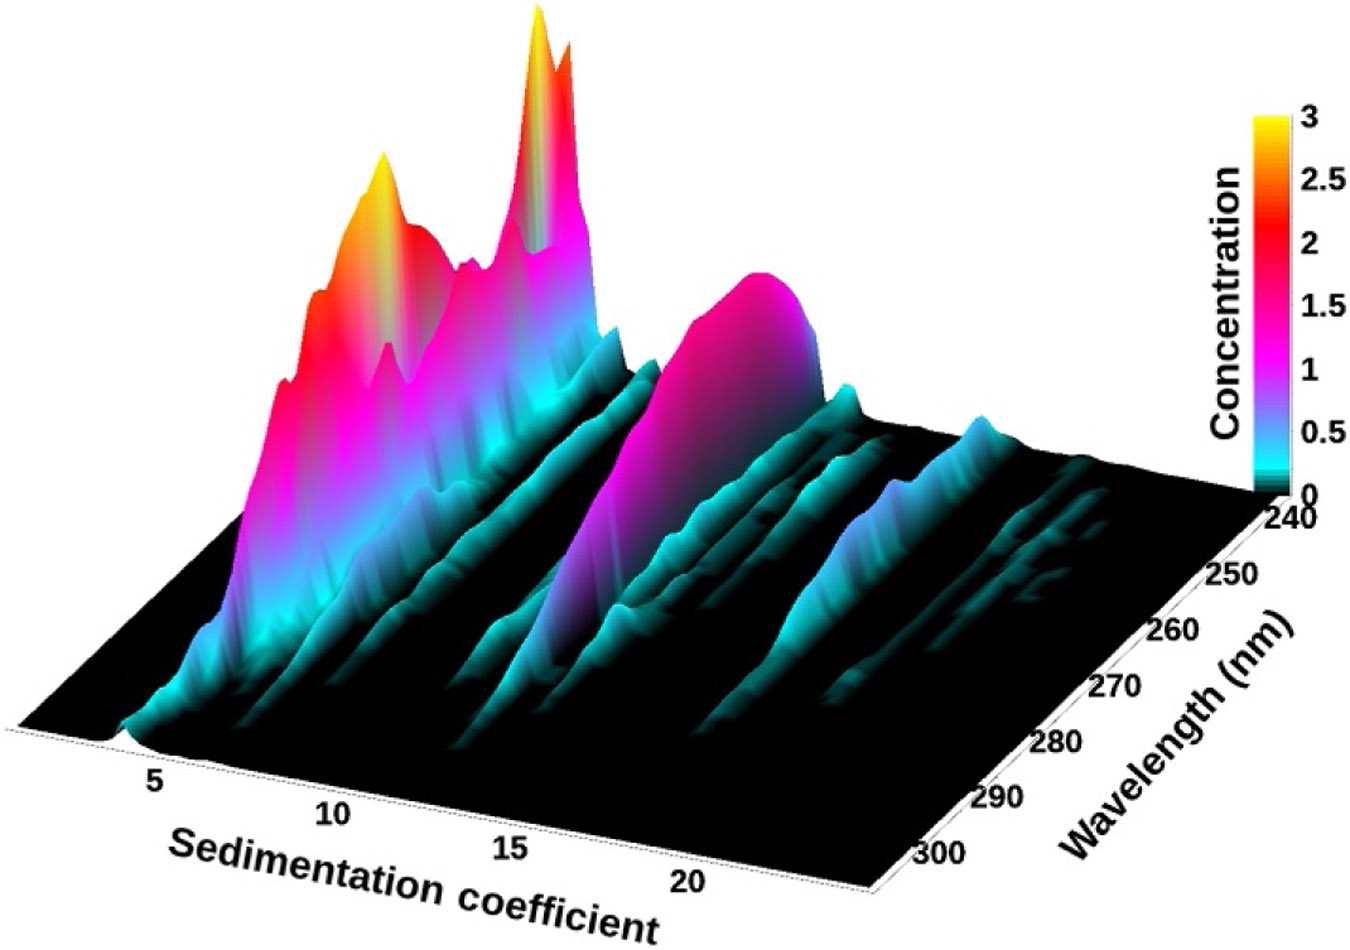
Figure 2.

3D view of the sedimentation profile as a function of wavelength for the 50:50 DNA-BSA mixture after 2DSA-Monte Carlo analysis. The protein absorbance spectrum at 4.3 S (two yellow (white in the print version) peaks) can be clearly distinguished from the DNA peak with absorbance maximum around 258 nm. Minor species can be identified based on their spectrum.
