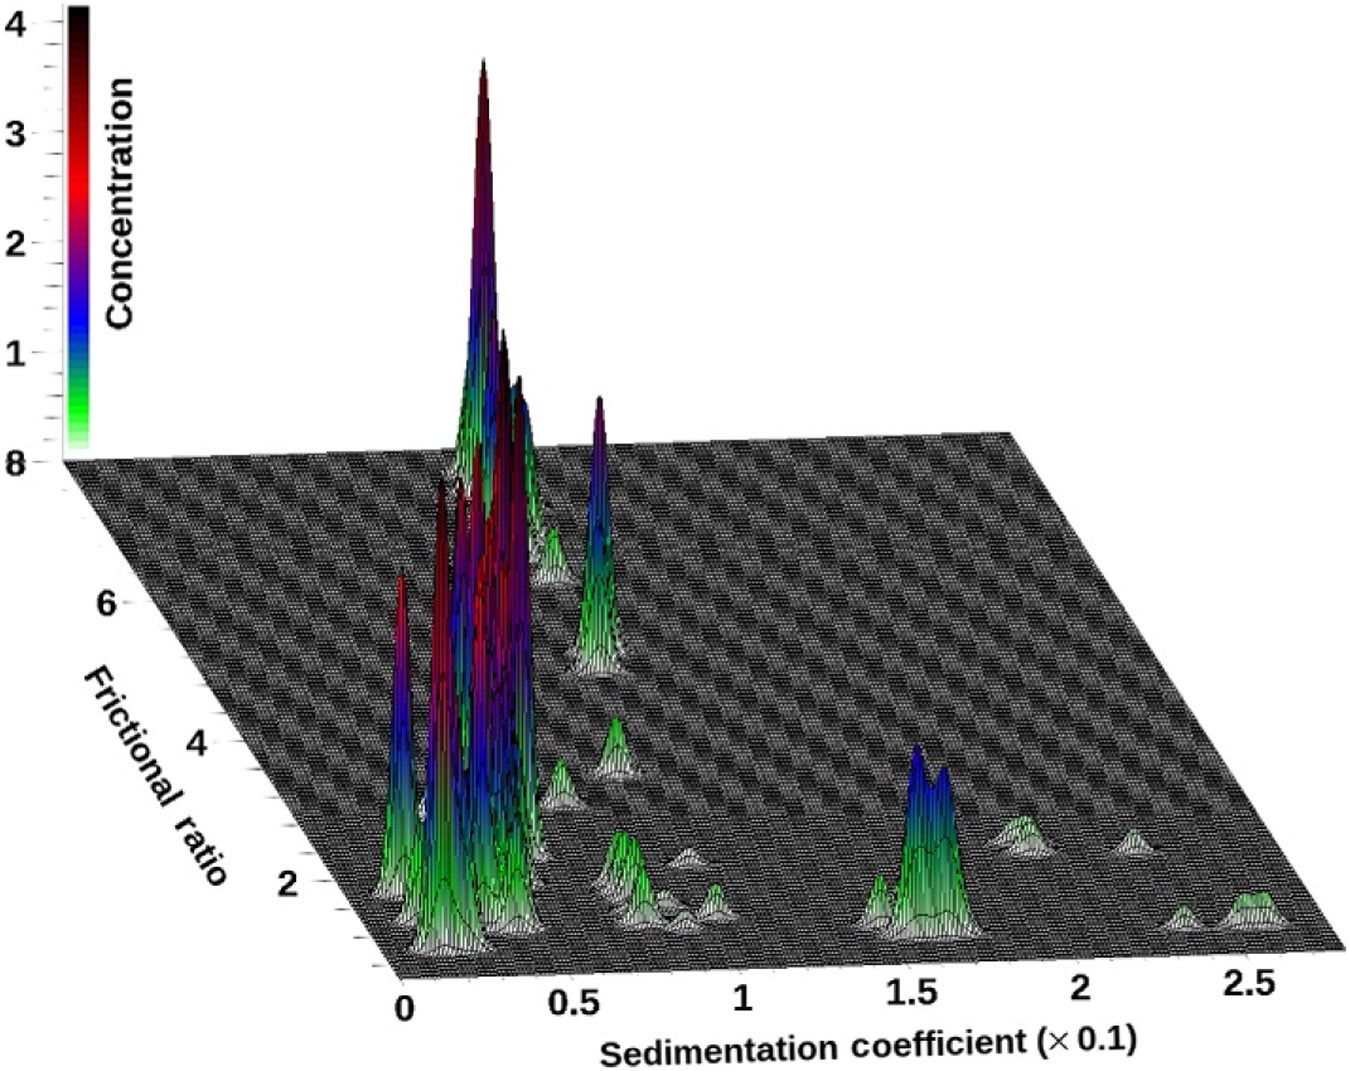
Figure 4.

3D plot of a globally combined vs. distribution for a 50:50 mixture of BSA and DNA fragments. Data collected on a Beckman-Coulter XL-A, at 258 and 278 nm. Data from three repeat experiments and from each wavelength were combined to generate this global view.
