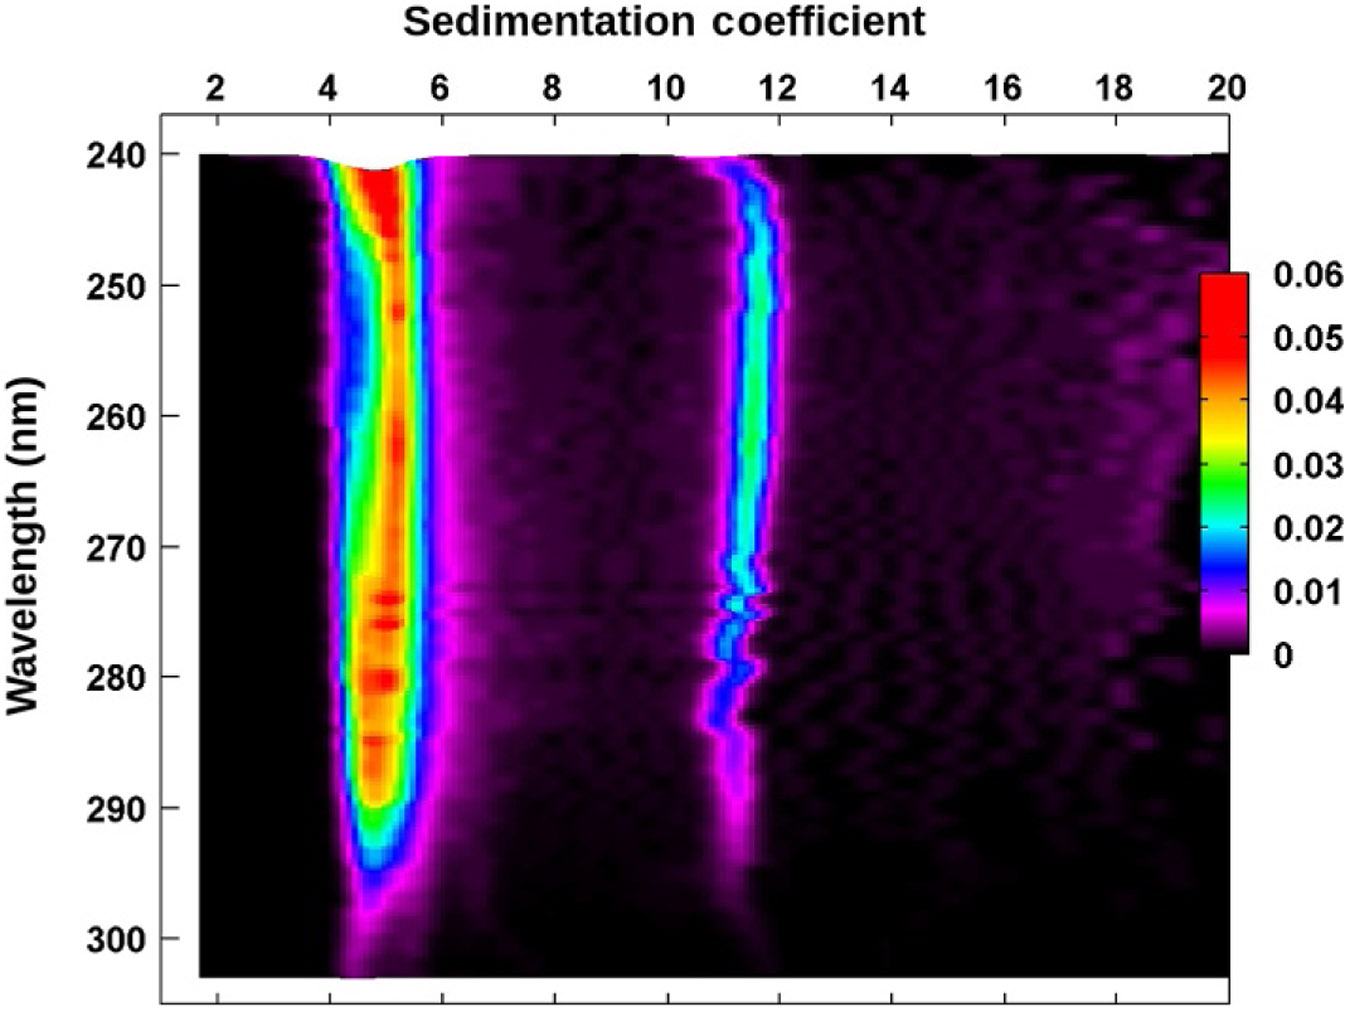
Figure 6.

van Holde–Weischet differential distribution projection plot as a function of wavelength for the BSA–DNA 50:50 mixture. The asymmetric shape of the peak between 4 and 6 S clearly indicates a heterogeneity in spectral properties originating from the closely sedimenting BSA and 208 bp DNA peaks. On the left side of the peak, the BSA extinction dominates;on the right side of the peak, the DNA extinction profile dominates. The peak at 11 S displays a DNA extinction profile only. The color (different gray shades for the print version) gradient indicates relative concentration.
