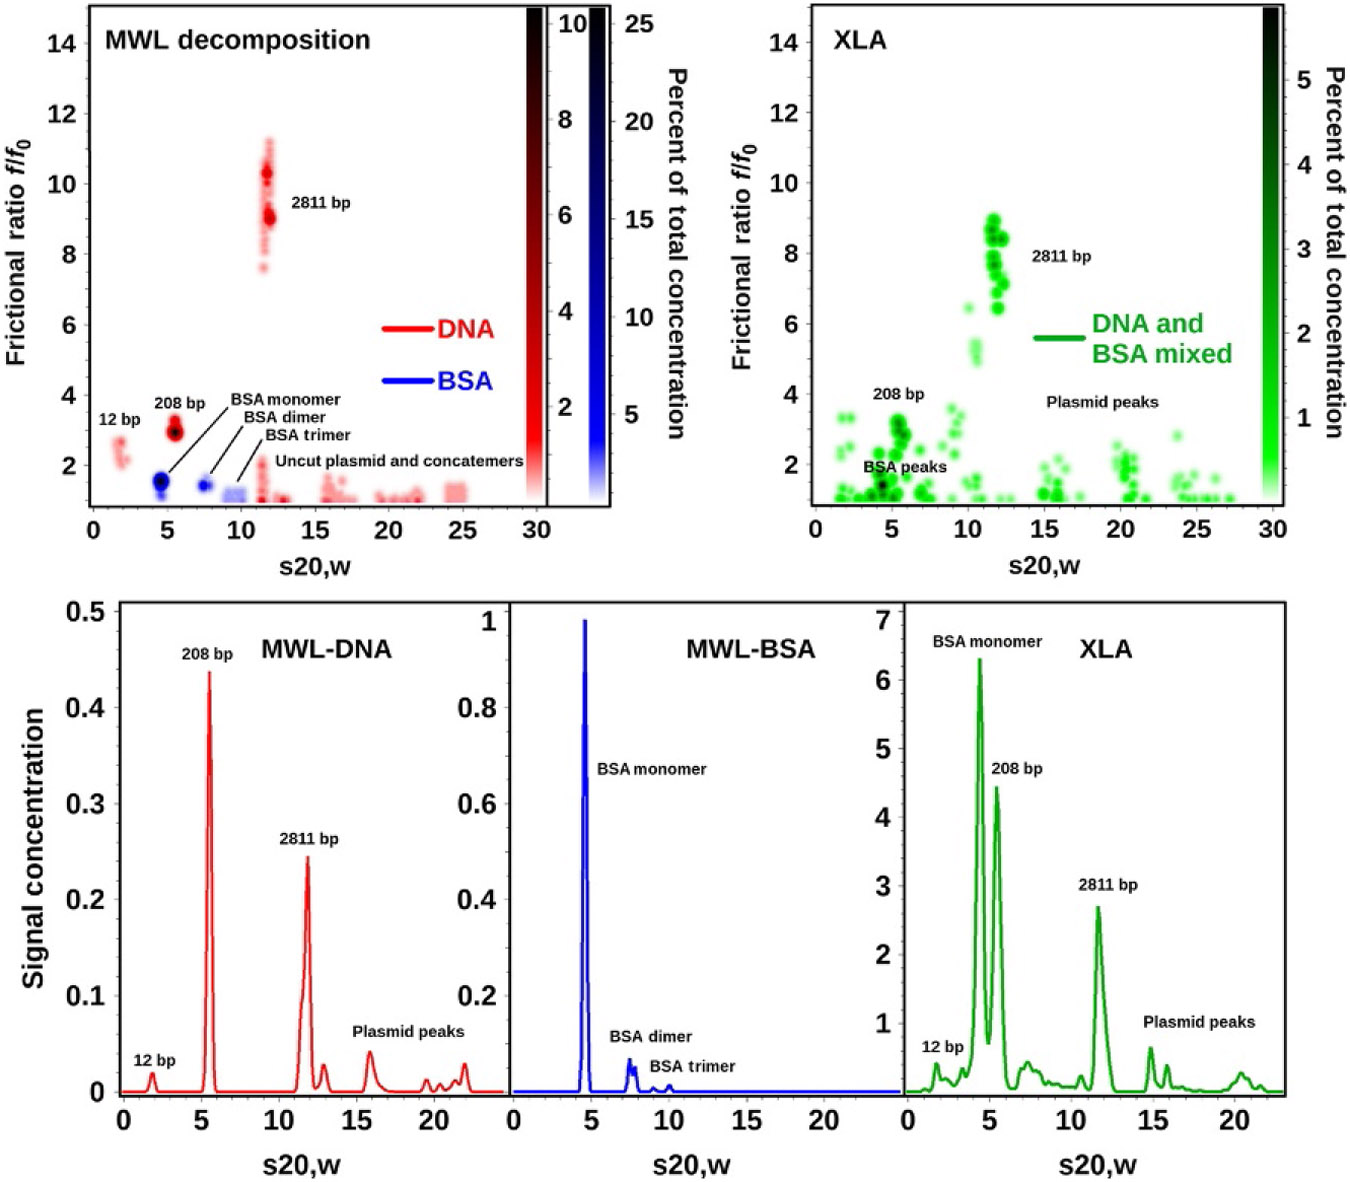
Figure 7.

Global genetic algorithm Monte Carlo analysis of decomposition results obtained from six different DNA and BSA mixtures analyzed on the open AUC MWL instrument (top left) and the dual-wavelength results obtained from the Beckman-Coulter XL-A (right panel). The separate decomposition results for DNA (red) and BSA (blue) are combined in the left panel pseudo-3D plot to illustrate the exceptional separation achieved by spectral decomposition which even separates species with nearly identical sedimentation coefficients (the two major species sedimenting near 5 S). This approach demonstrates the superior resolution obtained from MWL analysis compared to the global two-wavelength analysis performed on the Beckman-Coulter XL-A (right panel, green). Lower panel: differential distributions from the same data shown above (red): decomposition for DNA, blue: decomposition for BSA, green: nonseparated XL-A data for DNA-BSA mixtures globally fitted to genetic algorithm–Monte Carlo analysis. A color representation of this figure is provided in the color plate section to allow the reader to distinguish the DNA and BSA contributions based on color.
