Figure 1.

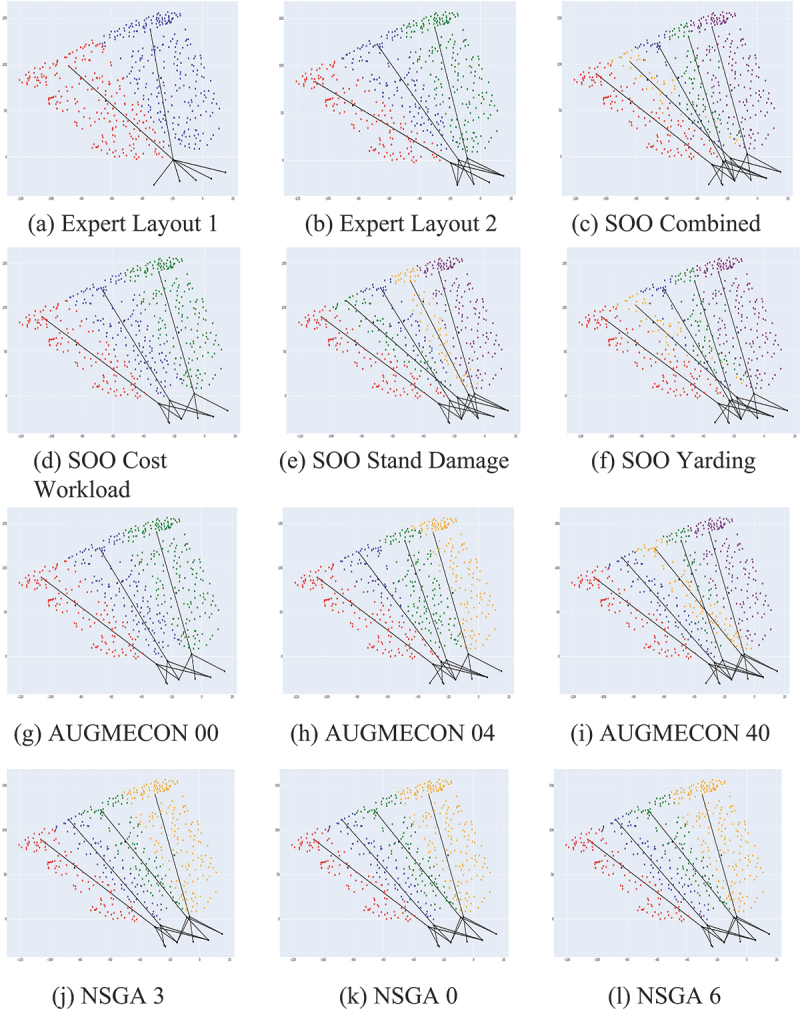
Comparison grid of cable-road layouts per technique. The dots represent trees, and their color the cable-road they are assigned to. The long black lines denote activated cable roads, and the three smaller lines their anchoring configuration.
