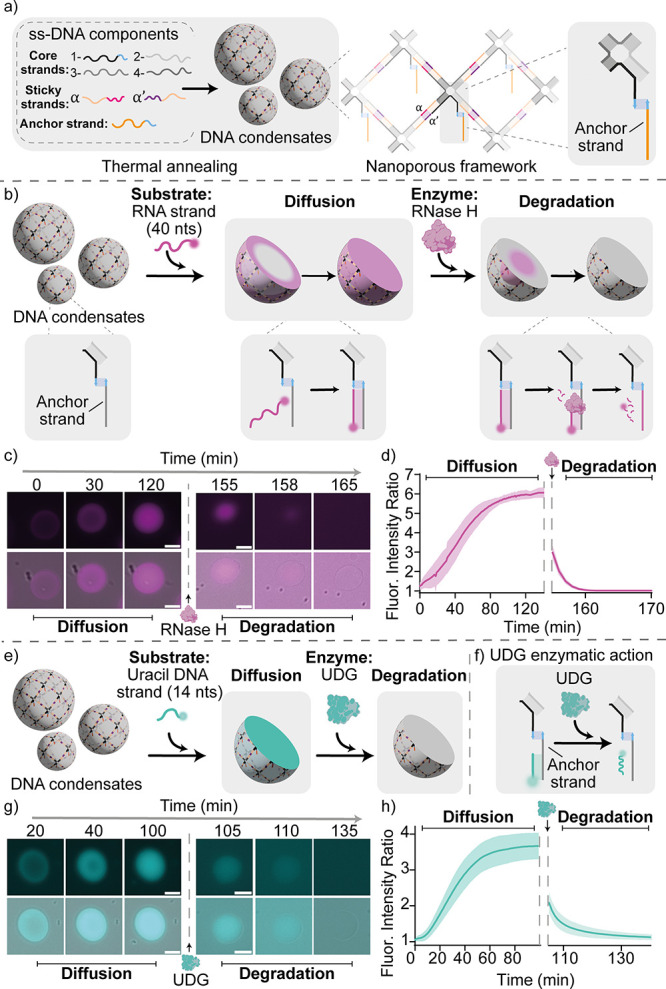
Figure 2.

Enzyme-responsive DNA condensates. a) Nanoporous DNA condensates, hosting homogeneously distributed anchor strands, are obtained through slow thermal annealing, from 90 to 20 °C, of the ssDNA components. Full details on nanostructure design and oligonucleotide sequences are reported in the SI (Figure S1). b) Cartoons and reaction schemes illustrating the diffusion and binding of a fluorophore-labeled RNA substrate within a DNA condensate, and its subsequent enzymatic degradation by RNase H. c) Epifluorescence micrographs (top) overlaid with bright-field images (bottom) of the diffusion, binding, and degradation process over time. d) Diffusion/binding and degradation kinetics tracked via the ratio of fluorescent signal samples within the condensates and the surrounding background. Data are shown as mean (solid line) ± standard deviation as obtained analyzing n = 352/219 condensates (diffusion stage/degradation stage, respectively) imaged across 3 technical replicates. e, f) Cartoons and reactions schemes illustrating the diffusion and binding of a fluorophore-labeled uracil DNA substrate and its degradation by UDG. g) Epifluorescence micrographs (top) overlaid with bright-field images (bottom) of the diffusion, binding, and degradation process over time. h) Diffusion/binding and degradation kinetics tracked via fluorescence intensity as for panel d. Data are shown as mean (solid line) ± standard deviation as obtained analyzing n = 807/155 condensates (diffusion stage/degradation stage, respectively) imaged across 12/3 technical replicates (diffusion stage/degradation stage, respectively). Experiments were performed in Tris HCl 20 mM, EDTA 1 mM, MgCl2 10 mM and 0.05 M NaCl; pH 8.0 at T = 30 °C. Sample preparation, annealing process and image analysis details are provided in SI Methods. All scale bars are 10 μm.
