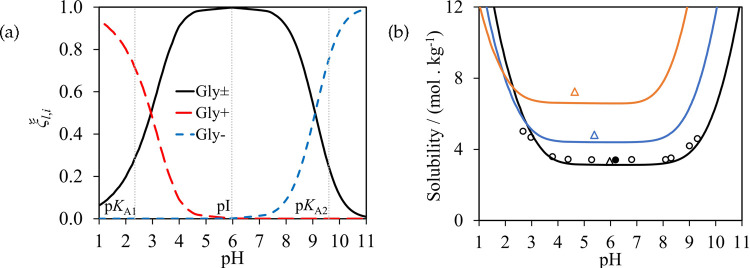
Figure 17.
(a) Relative concentration (ξl,i) of the glycine zwitterion (continuous black curve), the cation (long-dashed red curve), and the anion (short-dashed blue curve) at 298.15 K and 1 bar, as a function of pH. The pKA and pI values174 are denoted by the vertical black dotted lines. (b) The solubility of glycine in water at 298.15 K (black), 318.15 K (blue), and 348.15 K (orange) and at 1 bar as a function of pH. The continuous curves represent SAFT-γ Mie calculations and symbols represent experimental solubility data; circles denote pH-dependent data of Needham et al.167 and triangles solubility data at the isoelectric point (pI) of Dalton and Schmidt.80 The filled circle represents the data point used in optimizing the NH3+–COO– interaction, while empty symbols denote data not used in the parameter estimation.

