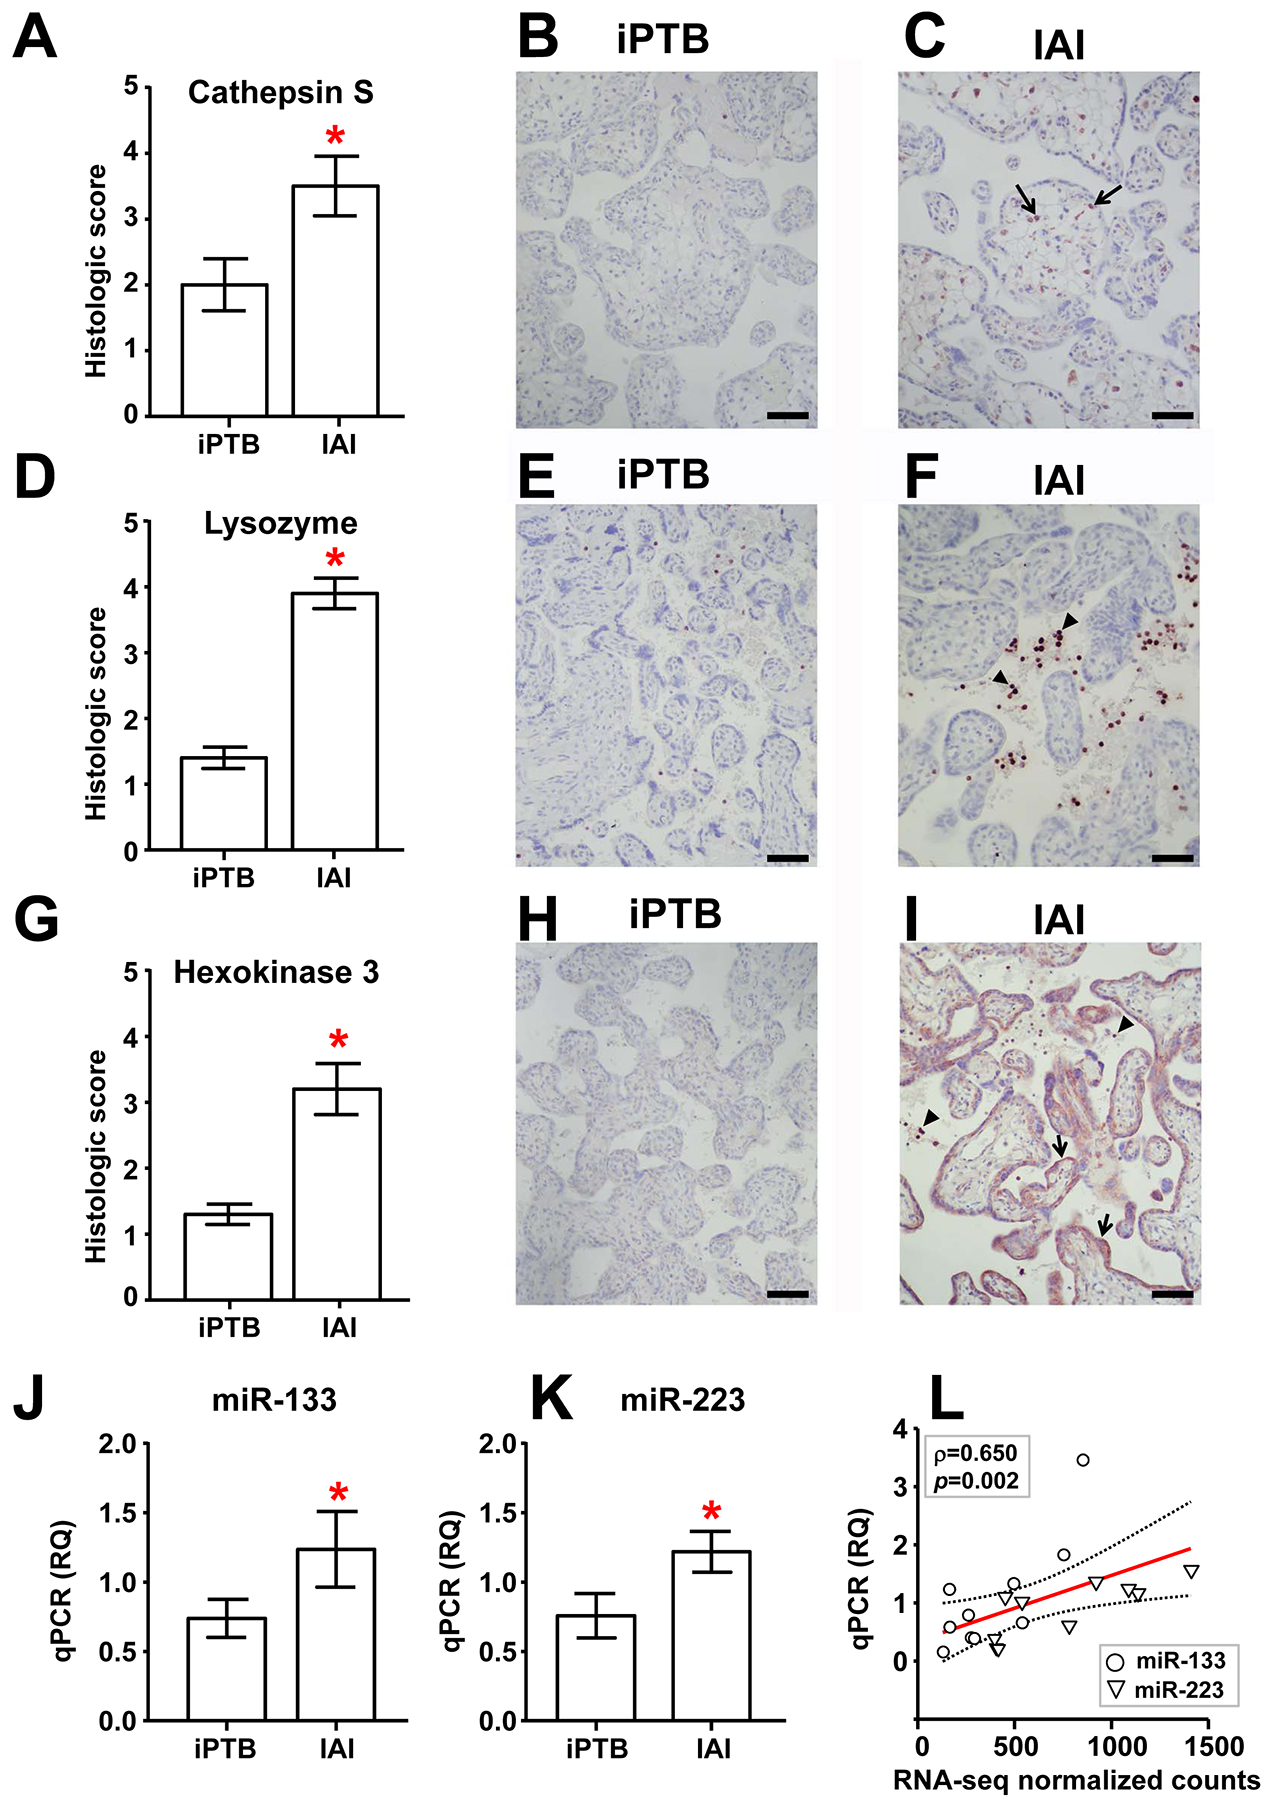
Figure 2. Validation of select sequencing results using immunohistochemistry (IHC) and real-time quantitative PCR (qPCR) in an expanded group of specimens.

Histological staining intensity (mean ± SEM, n=10/group) and representative photomicrographs are shown for IAI and iPTB villous placental samples labeled with antibodies directed against cathepsin S (A-C), lysozyme (D-F), and hexokinase 3 (G-I). Scale bars = 100 μm. Arrows and arrowheads depict cells exhibiting characteristic immunolabeling in each case (see main text). (J, K) Relative quantification (RQ) of mature miR-133a-3p (J) and miR-223–3p (K) in IAI and iPTB villous trophoblast specimens using qPCR (mean ± SEM, n=10/group). Asterisks indicate p < 0.05 by the Mann-Whitney rank-sum test. (L) Scatterplot and linear regression analysis (line of best fit and 95% confidence interval) comparing qPCR results with normalized RNA-seq feature counts for miR-133a-3p and miR-223–3p in the original IAI and iPTB VT specimens (n=5/group). Note that these were significantly correlated (Spearman ρ = 0.650, p=0.002).
