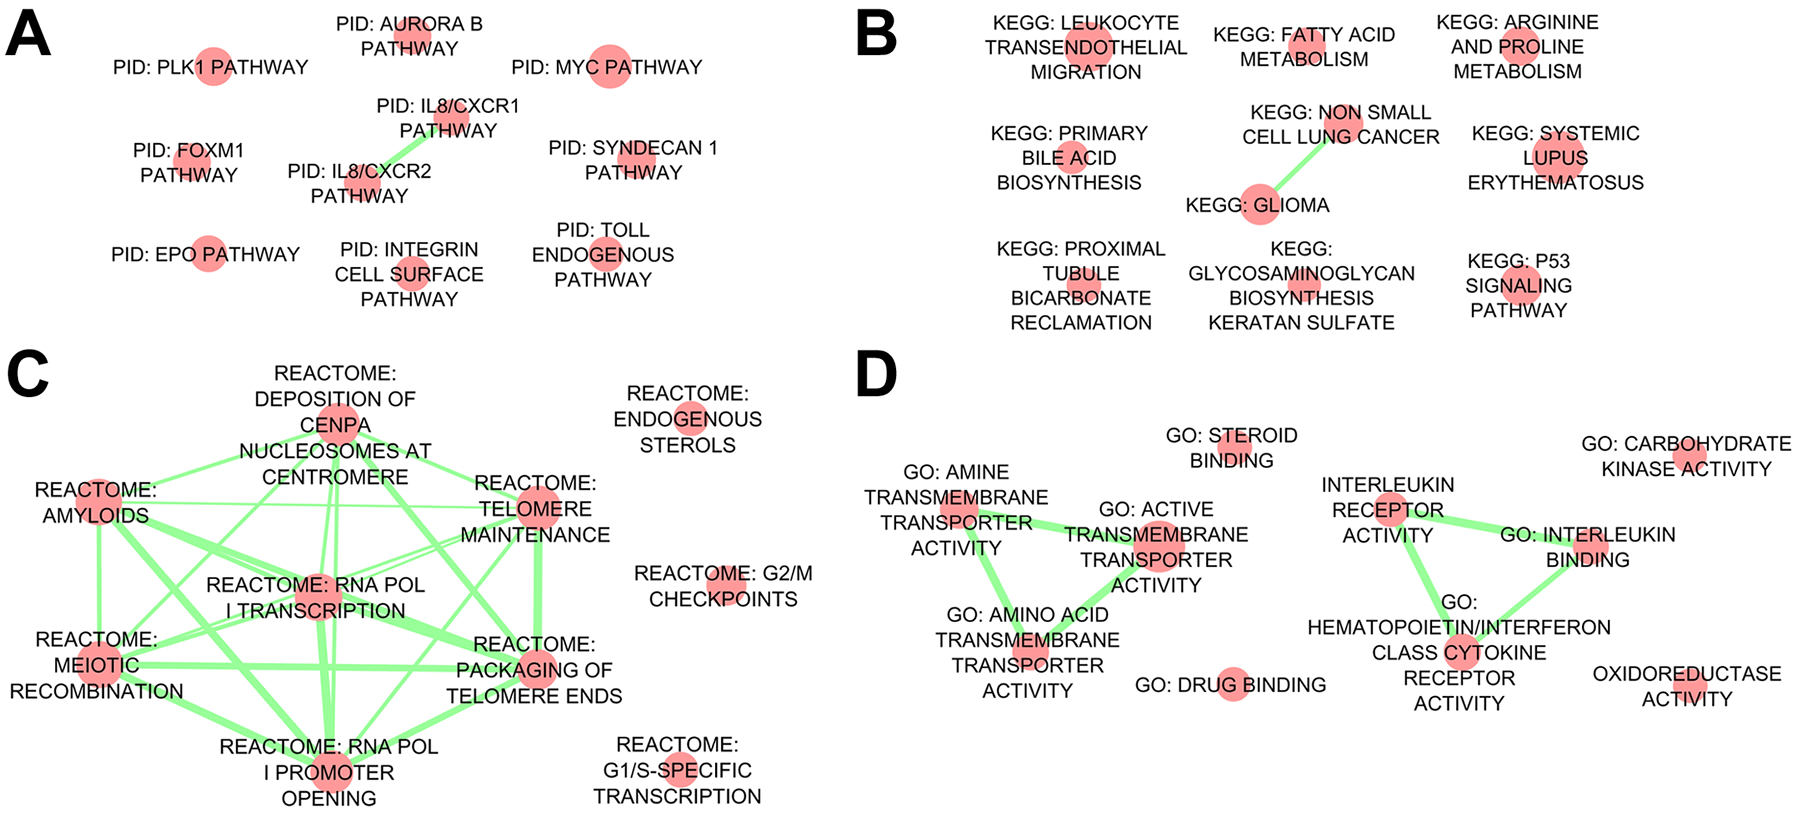
Figure 3. Gene Set Association Analysis (GSAA) of placental villous trophoblast specimens from pregnancies complicated by intra-amniotic infection (IAI) compared to idiopathic preterm birth (iPTB) controls.

The top ten Pathway Interaction Database (PID) (A), Kyoto Encyclopedia of Genes and Genomes (KEGG) (B), Reactome (C), and Gene Ontology (GO) molecular function (D) gene sets are represented as network diagrams. Red nodes represent enriched gene sets, while edges (green) represent overlap among mapped network objects within individual gene sets. We observed a highly connected Reactome subnetwork (panel C), resulting from numerous common histone transcripts shared among these pathways.
