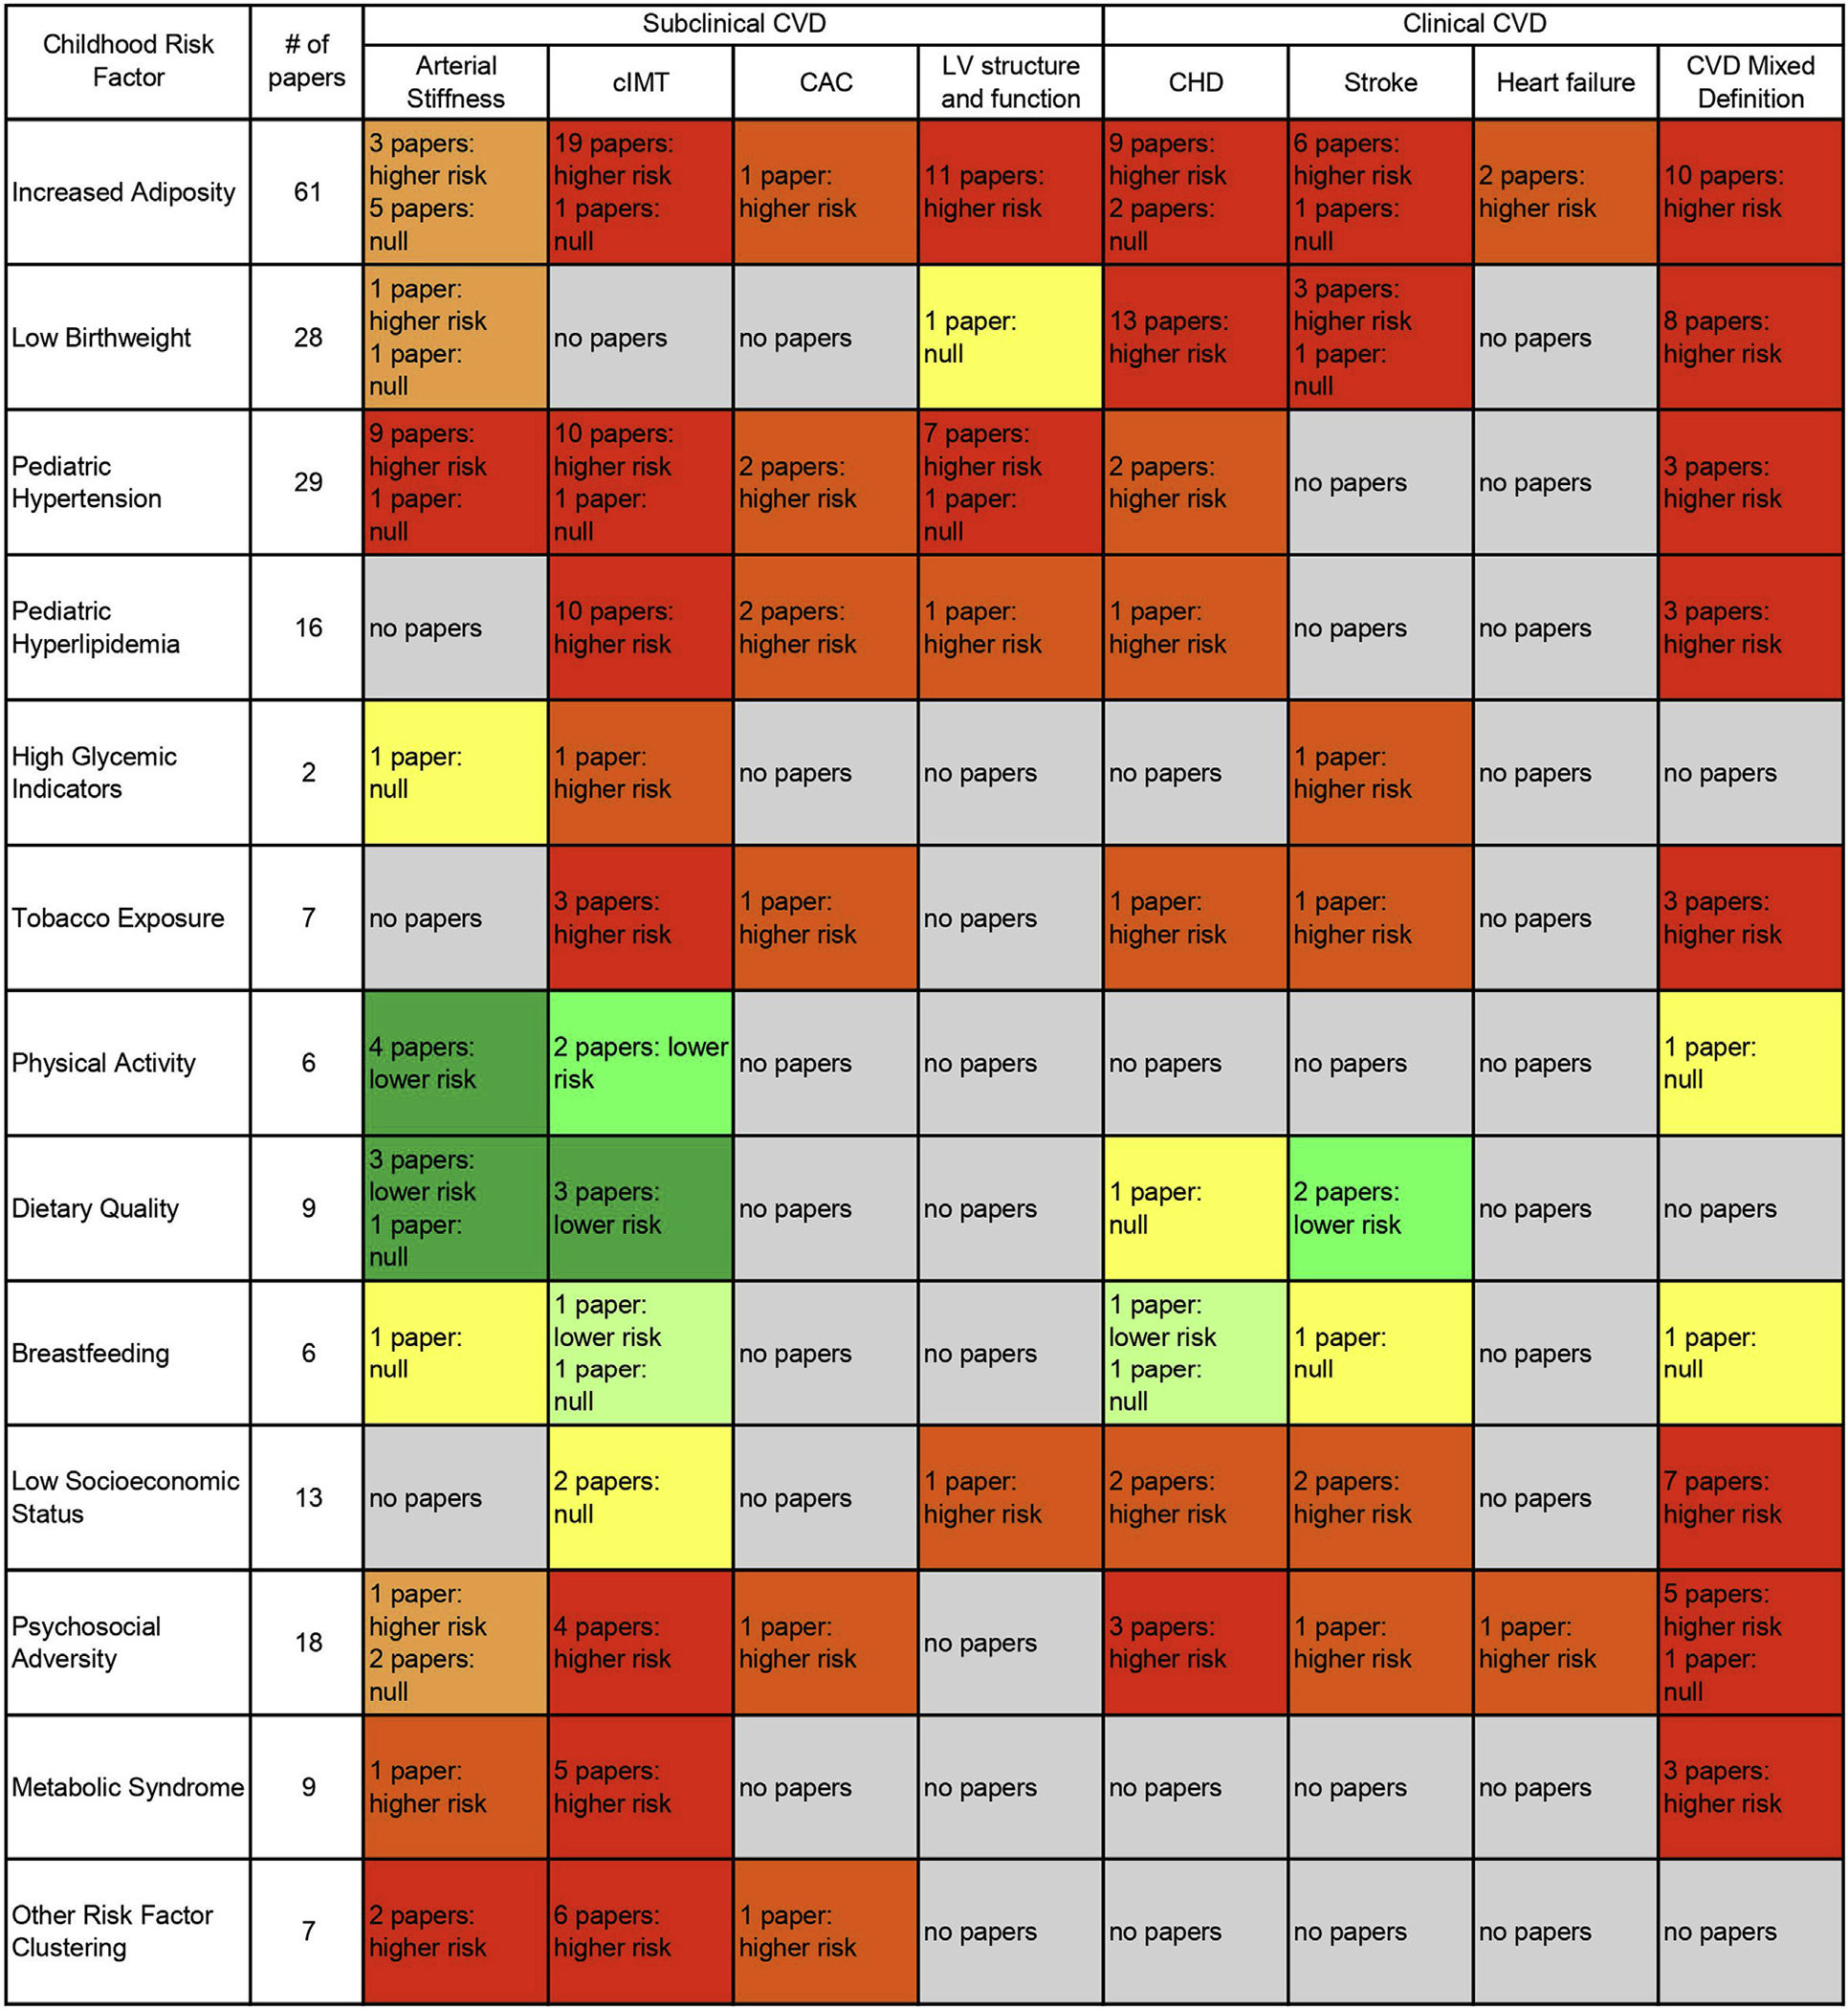
Figure 2.

Heat map of identified articles examining childhood exposures and adulthood CVD. Each box lists the number of articles corresponding the exposure and CVD outcome pair. Yellow indicates that only null associations have been observed between the exposure and outcome. Colors deepen from light orange to red with an increasing number of articles indicating the exposure may be associated with higher CVD outcome risk. Colors deepen from light green to dark green with an increasing number of articles indicating the exposure may be associated with lower CVD outcome risk. Gray indicates that no articles examining the exposure and outcome pair were identified in this review. Articles that included multiple subtypes of CVD (eg, CHD and stroke) in the outcome without estimating the association for each subtype of CVD separately were classified as “CVD Mixed Definition”.
