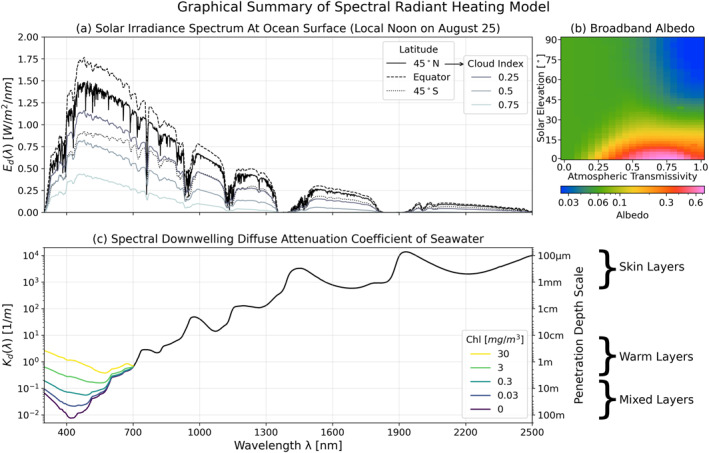
Figure 1.

Graphical depiction of Spectral Model components. (a) Clear‐sky spectra from Diffey (2015) at three latitudes for an example date and time, differentiated by line style. For the 45N latitude, the modification of the spectrum by the cloud index model of Siegel et al. (1999) is shown with color, demonstrating the preferential transmission of shorter wavelengths through clouds. (b) Broadband albedo from Payne (1972) as a function of atmospheric transmissivity and solar elevation, shown on a logarithmic color scale. (c) Diffuse attenuation coefficients at each wavelength in the solar spectrum, with chlorophyll‐dependence in the UV and visible from Morel et al. (2007), and infrared coefficients from Bertie and Lan (1996).
