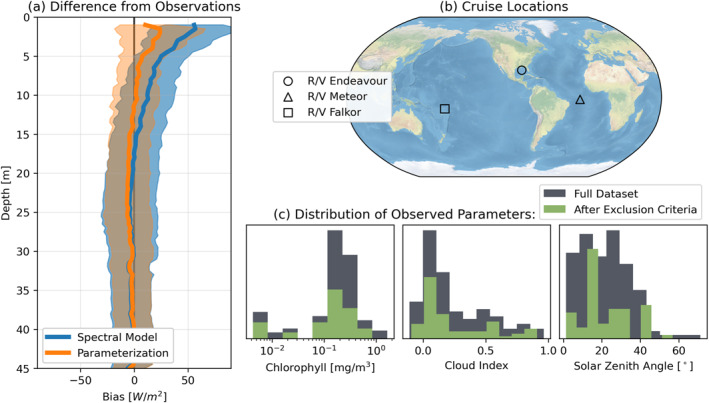
Figure 5.

(a) Comparison of integrated visible‐wavelength irradiance profiles from 64 multi‐spectral depth casts to both the Spectral Model (blue) and the Parameterization (orange), with solid lines showing the mean bias and shaded regions spanning one standard deviation. (b) Locations of the cruises (6 total cruises undertaken onboard 3 research vessels, see Section 4.2 for further details). (c) Histograms of the observed parameters used as input conditions to the Spectral Model (and Parameterization, in the case of chlorophyll concentration), demonstrating the range of conditions sampled.
