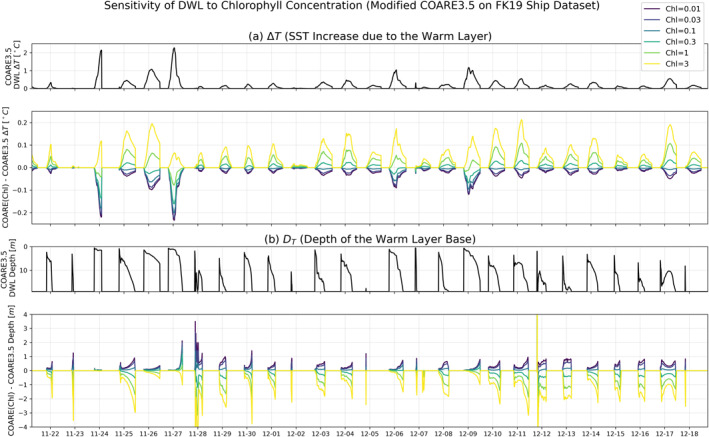
Figure 9.

Time series of the COARE3.5 DWL model output when forced with a month of shipboard observations from the tropical Pacific. Black lines show the standard model output for (a) DWL SST change and (b) DWL depth; colored lines below show the differences from the black lines when COARE3.5 is run with the new parameterization at a variety of realistic chlorophyll concentrations.
