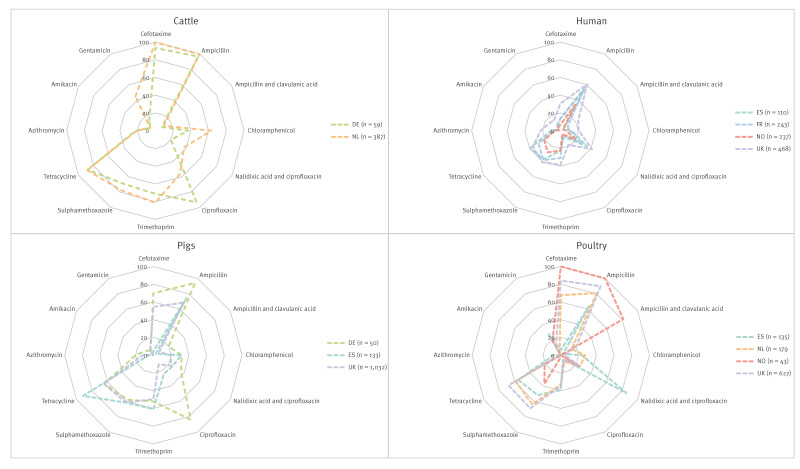
Figure 1.
Percentages of predicted genotypic resistance to different antimicrobial classes in Escherichia coli isolates, by isolate source, France, Germany, the Netherlands, Norway, Spain, the United Kingdom, 2013–2020 (n = 3,745)
DE: Germany; ES: Spain; FR: France; NL: the Netherlands; NO: Norway; UK: the United Kingdom.
Numbers in the central Y-axis of each spider graph indicate the proportions of resistance for each antimicrobial. All proportions based on fewer than 30 isolates (14 UK cattle isolates, 19 NL pig isolates and 9 DE poultry isolates) have been removed.

