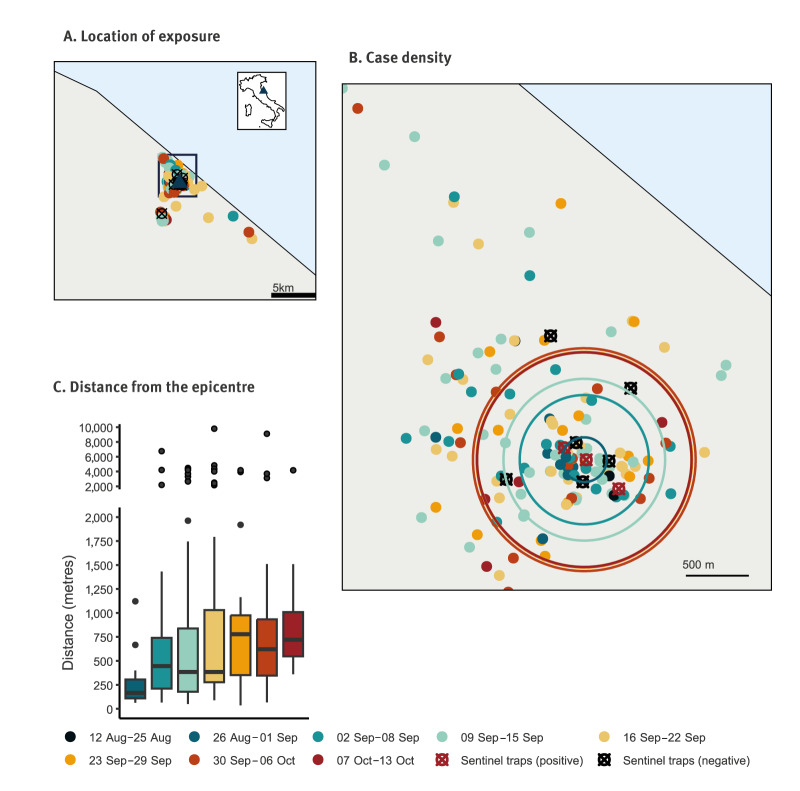
Figure 2.
Geographic distribution of probable and confirmed autochthonous dengue cases, by week of symptom onset, Fano, Italy, August–October 2024 (n = 199)
Panel A. The geographic distribution of dengue cases by exposure location across the outbreak area is presented. The black square highlights the area within Fano with the highest case density. In the top-right corner, a map of Italy indicates Fano municipality with a blue triangle.
Panel B. The geographic distribution of cases within the area of highest density is presented. The circles indicate the median distances from the epicentre by week of symptom onset.
Panel C. A boxplot showing the distances from the epicentre (defined as the centroid of geolocated cases from 12–25 August) for each week of symptom onset. Due to the small number of cases, data from the first 2 weeks of the outbreak were merged for the analysis. Number of cases: 12–25 Aug: n = 7; 26 Aug–1 Sep: n = 13; 2–8 Sep: n = 32; 9–15 Sep: n = 57, 16–22 Sep: n = 42, 23–29 Sep: n = 21; 30 Sep–6 Oct: n = 20; 7–13 Oct: n = 7.

