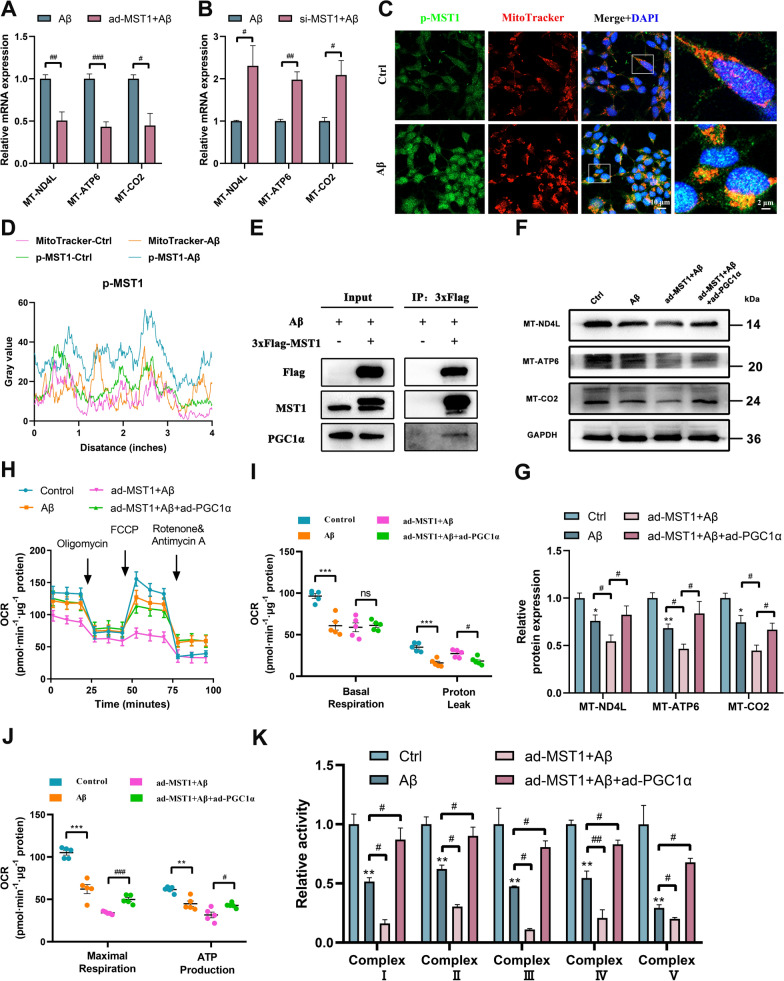
Fig. 8.
MST1 regulates the mitochondrial genes expression by binding to PGC1α in SH-SY5Y cell. According to the results of RNA-seq detection, three genes (MT-ND4L, MT-ATP6, MT-CO2) in the top 10 were selected for verification in Aβ-treated SH-SY5Y cells. A, B Relative expression MT-ND4L mRNA, MT-ATP6 mRNA, and MT-CO2 mRNA after overexpression or knockdown of MST1 in AD cell models (n = 3). C Representative images showing co-localization of p-MST1 and MitoTracker (Scale bar is 10 µm). (n = 3). Magnified image showing details of co-localisation (Scale bar is 5 μm). D Co-localization analysis of p-MST1 and MitoTracker (n = 3). E Co-IP followed by western blot analyses confirmed the binding between MST1 and PGC1α in the AD cell model. F–H Mitochondrial stress test analysis of oxygen consumption rate (OCR) in SH-SY5Y cells (n = 5) (F). Analysis of oxygen consumption rate (OCR), including basal respiration (G), proton leak (G), maximal respiration (H), ATP production (H). I, J Relative levels of MT-ND4L, MT-ATP6, and MT-CO2 protein in control, Aβ, ad-MST1 + Aβ, ad-MST1 + Aβ + ad-PGC1α group (n = 3). K Relative complex I-V enzyme activity in SH-SY5Y cells in the Control, Aβ, ad-MST1 + Aβ, ad-MST1 + Aβ + ad-PGC1α groups (n = 3). All data represent means ± SEMs. *, Compared with the control group, **p < 0.01. #, Comparison between intervention groups, #p < 0.05; ##p < 0.01 and ###p < 0.001

