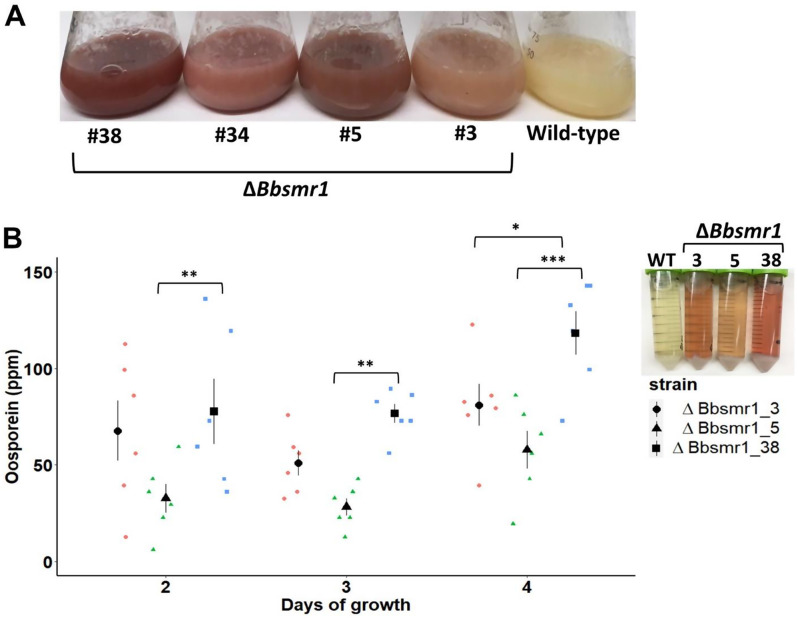
Fig. 2.
Oosporein production during in vitro growth. A) Oosporein production (in ppm) by ΔBbsmr1 strains during four days of growth in 50-mL PDB at 28 °C and 250 rpm. The pink/red color in the culture supernatant of ΔBbsmr1 strains is the evidence of oosporein presence, whilst null oosporein was found in the WT’s liquid cultures. B) Kinetics of oosporein production (ppm) during four days cultivation. Significant differences in oosporein production (mean ± SE, n = 6) between mutants within each time interval are indicated by asterisks (* P < 0.05, ** P < 0.01 or *** P < 0.001) according to Tukey’s test. Different symbols and colors represent the mutants

