Abstract
Objective
Differentiating intramedullary spinal cord tumor (IMSCT) from spinal cord tumefactive demyelinating lesion (scTDL) remains challenging with standard diagnostic approaches. This study aims to develop and evaluate the effectiveness of a magnetic resonance imaging (MRI)-based radiomics model for distinguishing scTDL from IMSCT before treatment initiation.
Methods
A total of 75 patients were analyzed in this retrospective study, comprising 55 with IMSCT and 20 with scTDL. Radiomics features were extracted from T1- and T2-weighted imaging (T1&T2WI) scans upon admission. Ten classification algorithms were employed: logistic regression (LR); naive bayes (NaiveBayes); support vector machine (SVM); k nearest neighbors (KNN); random forest (RF); extra trees (ExtraTrees); eXtreme gradient boosting (XGBoost); light gradient boosting machine (LightGBM); gradient boosting (GradientBoosting); and multi-Layer perceptron (MLP). The performance of the optimal model was then compared to radiologists' assessments.
Results
This study developed 30 predictive models using ten classifiers across two imaging sequences. The MLP model with two sequences (T1&T2WI) emerged as the most effective one, showing superior accuracy in MRI analysis with an area under the curve (AUC) of 0.991 in training and 0.962 in testing. Moreover, statistical analyses highlighted the radiomics model significantly outperformed radiologists' assessments (p < 0.05) in distinguishing between IMSCT and scTDL.
Conclusion
We present an MRI-based radiomics model with high diagnostic accuracy in differentiating IMSCT from scTDL. The model’s performance was comparable to junior radiologists, highlighting its potential as an effective diagnostic aid in clinical practice.
Supplementary Information
The online version contains supplementary material available at 10.1186/s12880-024-01499-8.
Keywords: Intramedullary spinal cord tumor, Tumefactive demyelinating lesion, Magnetic resonance images, Radiomics
Introduction
Primary spinal cord tumors account for 2%–4% of all central nervous system malignancies [1, 2]. Among these, intramedullary spinal cord tumor (IMSCT) comprises 20%–30% of primary spinal cord tumors, with astrocytoma and ependymoma representing the predominant types [3]. These tumors commonly occur in the cervical or thoracic spine [4, 5] and typically present with symptoms such as back or radicular pain, followed by neurological deficits like motor weakness or sensory disturbances [6]. Accurate preoperative evaluation is crucial in formulating treatment strategies for IMSCT, with surgical gross total resection often being the primary approach [7]. Differentiating IMSCTs from other intramedullary lesions, such as spinal cord tumefactive demyelinating lesion (scTDL), can be challenging [8–10]. scTDL, initially described by Van der Velden et al., is identified by predominantly white matter areas exceeding 2 cm [8, 11]. The rarity of spinal cord involvement cases has limited detailed clinical and radiographic documentation [12]. The treatment for scTDL differs significantly from that for IMSCT, with corticosteroids and symptom-relieving medications primarily administered [13].
Magnetic resonance imaging (MRI) stands as the first-line method for diagnosing IMSCT and scTDL. IMSCT generally appears as isointense to hypointense on T1-weighted images and hyperintense on T2-weighted images [14], while scTDL often displays similar imaging characteristics and clinical presentations [12], contributing to a high risk of misdiagnosis between the two conditions. Current diagnostic methods for scTDL, including cerebrospinal fluid (CSF) analysis, are typically invasive, highlighting the need for a non-invasive alternative to enhance diagnostic accuracy.
Radiomics, an emerging field, utilizes a wide range of imaging features invisible through traditional assessments, such as texture, intensity, heterogeneity, and shape, which reflect cellular-level variations within lesions [15–17]. Previous studies have employed radiomics models for the preoperative prediction of central system conditions like glioma and meningioma [18, 19], and non-central system diseases including breast, colorectal, bladder cancer, and lung adenocarcinoma [20–23], indicating its potential application in clinical diagnosis. However, machine learning and radiomics applications in predicting differential diagnoses between IMSCT and scTDL remains underexplored. Therefore, this study aims to develop an effective preoperative predictive model leveraging radiomic features to enhance diagnostic of these two lesions.
Materials and methods
Study population
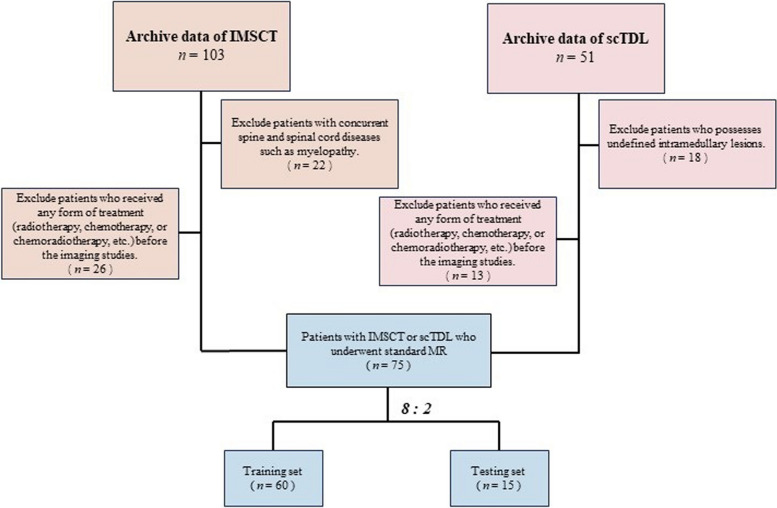
This analysis included 75 patient records from October 2018 to August 2023. Ethical approval is granted by the Ethics Committee of Southeast University (approval number: 2023ZDSYLL446-P01). Patients' informed consent was waived due to the utilization of anonymized data (Fig. 1).
Fig. 1.
Flow chart demonstrating the inclusion and exclusion criteria for the study participants with IMSCT and scTDL
For IMSCT patients, the inclusion criteria were those: 1) with pathological diagnosis of IMSCT, 2) had pre-treatment MRI data upon admission (within 10 days). The exclusion criteria were those: 1) with concurrent spine and spinal cord diseases such as myelopathy, 2) received any form of treatment (radiotherapy, chemotherapy, or chemoradiotherapy, etc.) before the imaging studies.
For scTDL patients, the inclusion criteria include those: 1) with both radiological evidence and cerebrospinal fluid test results (AQP4-IgG positive or the presence of oligoclonal bands), 2) had pre-treatment MRI data upon admission (within 10 days). The exclusion criteria were patients who 1) possesses undefined intramedullary lesions, 2) received any form of treatment (radiotherapy, chemotherapy, or chemoradiotherapy, etc.) before the imaging studies.
MRI Scanning
MRI images were obtained using 3.0 T scanners (Siemens MAGNETOM Verio 3.0 T, or Philips Ingenia 3.0 T). Both T1- and T2-weighed images were acquired in sagittal, axial, and coronal sections. Supplementary Table 1 shows the parameters of the selected sequences of each MRI scanner.
Image segmentation
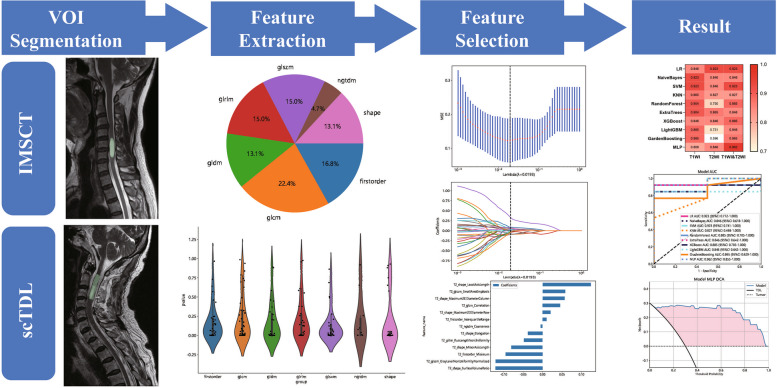
The workflow of the study is shown in Fig. 2. We accessed DICOM format images of axial T1WI and T2WI for each case on the Picture Archiving and Communication System (PACS). Subsequent manual segmentations of the volume of interest (VOI) were carried out utilizing 3D Slicer software (HTTP:// https://www.slicer.org; version 5.0.3). The target of image segmentation is the lesion area. When there were multiple lesions in the spinal cord, the largest lesion was chosen.
Fig. 2.
Radiomics workflow
Two radiologists (Rad. A and B) defined the VOI independently in a blinded manner. VOI delineation was repeated 2 months later to evaluate the intra-observer reliability. The intraclass correlation coefficient (ICC) was calculated for each feature to assess inter-observer consistency and intra-observer reliability. Cases with an ICC below 0.75 were omitted from further analysis.
Data preprocessing
The dataset was randomly divided into the training and testing sets in an 8:2 ratio. The training dataset included all cases for model development, while the testing dataset was used for external validation of the model's performance.
Voxel spacing refers to the physical distance separating two adjacent voxels within an image. Medical imaging data often present variability in voxel spacing, attributed to the use of different scanners or imaging protocols. To counteract the variability in voxel spacing, spatial normalization techniques are commonly applied. In our study, we employed a fixed-resolution resampling technique to overcome these spatial challenges. Through resampling, all images were adjusted to a uniform voxel spacing of 3 mm. Subsequently, image data underwent z-score standardization for intensity normalization, ensuring a mean of zero and a standard deviation of one.
Radiomics feature extraction
The handcrafted features in our analysis are categorized into three main types: 1) geometric, involving the lesion's three-dimensional shape and structure; 2) intensity, detailing the distribution of voxel intensities across the tumor and offering insights into the intensity patterns; and 3) texture, which delves into a more sophisticated level of spatial arrangement of voxel intensities, elucidating complex patterns and interrelationships.
To capture detailed texture information, we employed advanced techniques such as the Gray Level Co-occurrence Matrix (GLCM), Gray Level Run Length Matrix (GLRLM), Gray Level Size Zone Matrix (GLSZM), and the Neighboring Gray Tone Difference Matrix (NGTDM). We identified a total of 107 unique handcrafted features, including 18 focused on shape, 14 on first-order statistics, and 75 on texture characteristics. The extraction of these features was executed through the PyRadiomics platform (available at http://pyradiomics.readthedocs.io).
Radiomics feature selection
An independent sample T-test and univariate feature screening were applied to all radiomics features. For multiple comparisons, the Bonferroni correction method was applied to adjust the significance threshold, with only those features demonstrating an adjusted p < 0.05 being considered significant. To reduce multicollinearity, Pearson's correlation analysis was conducted, and features exhibiting a Pearson's r value greater than 0.9 between any pair of features were removed.
In the process of feature selection, a strategy of greedy recursive elimination was implemented. This method progressively removes the most redundant feature in the set during each cycle. Additionally, the Least Absolute Shrinkage and Selection Operator (LASSO) technique was employed for multivariable feature selection, aiding in identifying a more impactful subset of features for developing the classification model. The LASSO's optimization goal can be described by the formula:
where n represents the sample size, α is a predefined constant, and denotes the L1-norm of the coefficient vector.
Radiomics model construction
Models based on individual MRI sequences (T1WI or T2WI) as well as a dual-sequence model were developed using ten different classification algorithms. The performance of the single-sequence models was compared to the combined model. Receiver Operating Characteristic (ROC) curves for both the training and validation groups were generated for both the training and testing groups to assess predictive accuracy. For each group, we computed the mean values of the Area Under the ROC Curve (AUC), as well as the accuracy, F1-score, sensitivity, and specificity metrics. Furthermore, to ascertain the clinical applicability of these models, we conducted analyses using calibration curves and decision curve analysis (DCA) for each model.
Radiologists' diagnoses
Two junior radiologists (Rad. C and D), each with diagnostic experience under 5 years made the radiological diagnosis for all cases independently in a blinded manner. Then, we employed the best radiomics model for comparison with the radiologists' models. We assessed the discriminative prowess of the radiologists and the radiomics model using the Delong test. A p value less than 0.05 signified statistical significance. We gauged the inter-reader consensus between the radiologists via the Cohen kappa test. An excellent agreement was represented by a kappa value within the range of 0.81–1.00, a good agreement within 0.61–0.80, a moderate agreement in the span of 0.41–0.60, while a fair agreement fell between 0.21–0.4, and poor agreement ranged from 0 to 0.2.
Statistical analysis
SPSS software (version 26.0, IBM, USA) was used for statistical analysis. Results were presented as mean ± standard deviation or median ± quartiles (conforms to a normal distribution). For comparisons between groups, we utilized the T test for continuous variables and the Chi-square test for categorical variables. A statistical significance was established with a p value less than 0.05.
Results
Patient characteristics
A total of 75 patients were included, of whom 55 had IMSCT (mean age 50.3 years) and 20 had scTDL (mean age 50.0 years). The scTDL group included patients diagnosed with multiple sclerosis (MS) accounting for 55.0% (n = 11), and neuromyelitis optica (NMO) accounting for 45.0% (n = 9). The IMSCT group exclusively comprised patients diagnosed with ependymoma (EPN) representing 87.3% (n = 48) and astrocytoma (AST) representing 12.7% (n = 7). The scTDL group had lesions predominantly in the cervical spinal cord (75.0%, n = 15), with a minority in the thoracic spinal cord (25.0%, n = 5). In contrast, lesions in the IMSCT group were more widely distributed with 54.6% (n = 30) in the cervical spinal cord, 23.6% (n = 13) in the thoracic spinal cord, and 21.8% (n = 12) in the lumbar spinal cord. Data is presented in Table 1.
Table 1.
Characteristics of the enrolled patients (n = 55)
| scTDL | IMSCT | P value | |
|---|---|---|---|
| Age | 49.95 ± 16.44 | 50.31 ± 15.57 | 0.671 |
| Gender | |||
| Male(%) | 7 (35.00) | 29 (52.73) | 0.170 |
| Female(%) | 13 (65.00) | 26 (47.27) | |
| Diagnosis | |||
| AST(%) | / | 7 (12.73) | |
| EPN(%) | / | 48 (87.27) | |
| MS(%) | 11 (55.00) | / | |
| NMO(%) | 9 (45.00) | / | |
| Location | |||
| Cervical(%) | 15 (75.00) | 30 (54.55) | 0.000 |
| Thoracic(%) | 5 (25.00) | 13 (23.64) | |
| Lumbar(%) | 0 (0.00) | 12 (21.82) | |
Student's t-test for the normally distributed continuous variable (age) (conforms to a normal distribution) and Pearson chi-square test for the categorical variables (gender)
AST Astrocytoma, EPN Ependymoma, MS Multiple Sclerosis, NMO Neuromyelitis Optica
The MLP two-sequence model as the most efficient prediction model
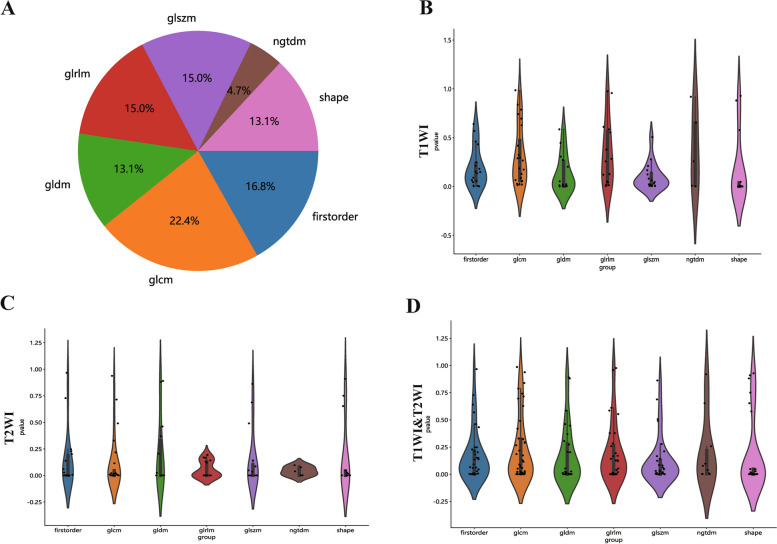
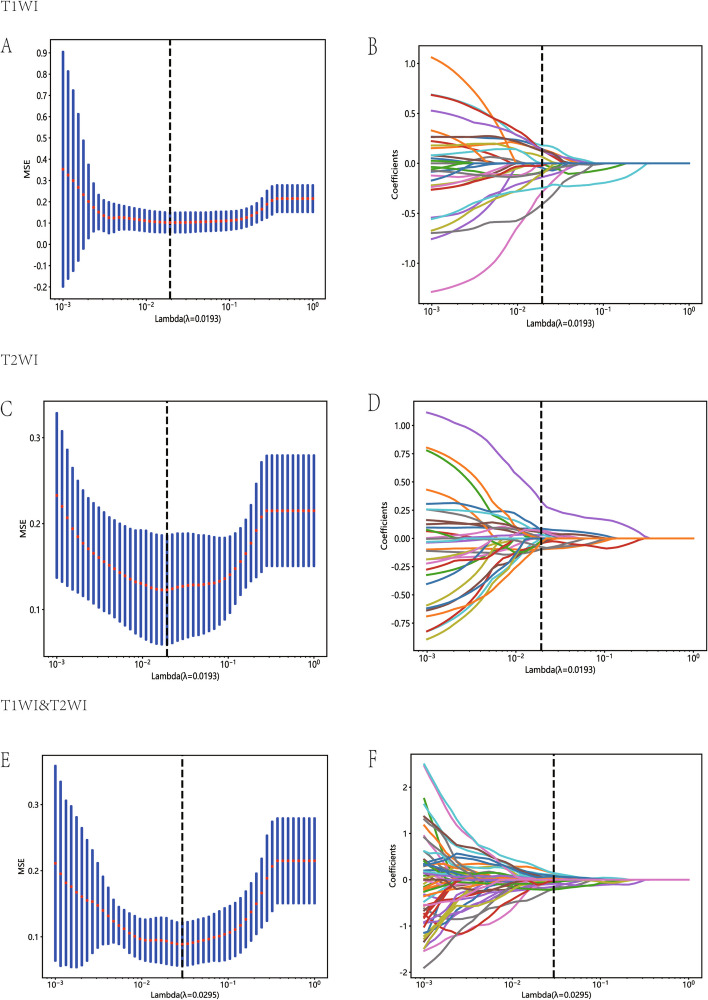
Radiomic features demonstrating an ICC of ≥ 0.85 were deemed to have high reliability both within and between raters. Spearman's correlation coefficients were calculated to assess multicollinearity, retaining only features with low inter-correlations (in Supplementary Table 2). Figure 3 illustrates the ICC values along with their corresponding p values for these features. The LASSO algorithm was subsequently applied to determine optimal the best feature set for T1, T2, and the combined datasets (Fig. 4).
Fig. 3.
The proportion, distribution and p values of various radiomics features
Fig. 4.
Diagram of the feature selection process. Area under the curve under different number of features in the least absolute shrinkage and selection operator fitting process (A, C and E). Diagram of the characteristic and coefficient change under different α parameters for the three models (B, D and F). (Top: T1WI; Middle: T2WI; Bottom: T1&T2WI)
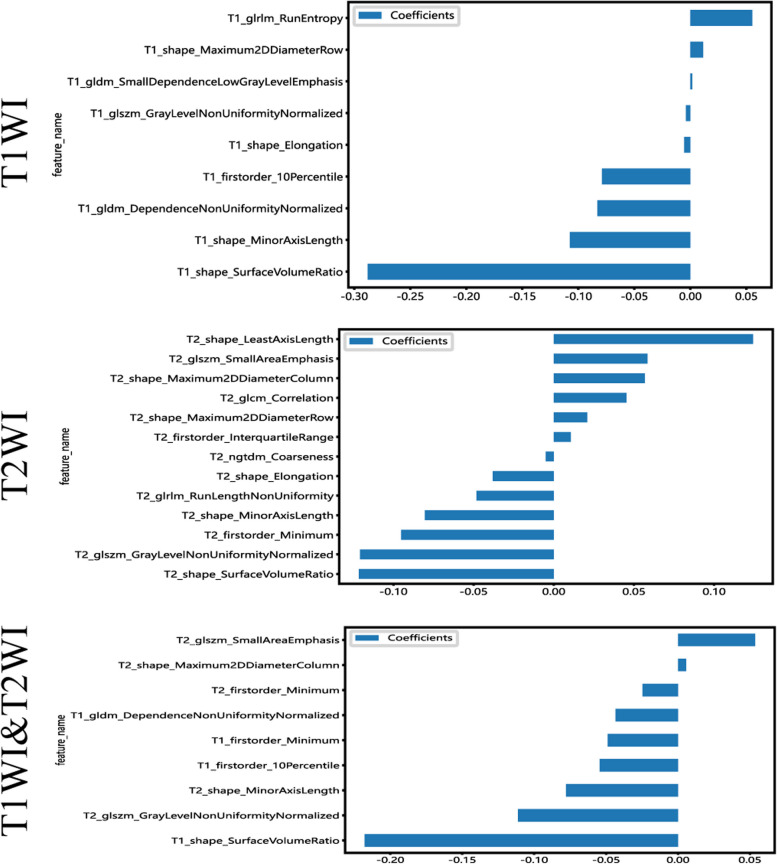
The features with the non-zero coefficient value were retained, including two first-order statistical features, three 3D shape features, two GLSZM features, and one GLDM feature (first order minimum in common, Fig. 5). The radiomics signature was then established based on the these chosen features.
Fig. 5.
Bar chart showing the selected features in corresponding coefficients, as identified by Lasso Regression
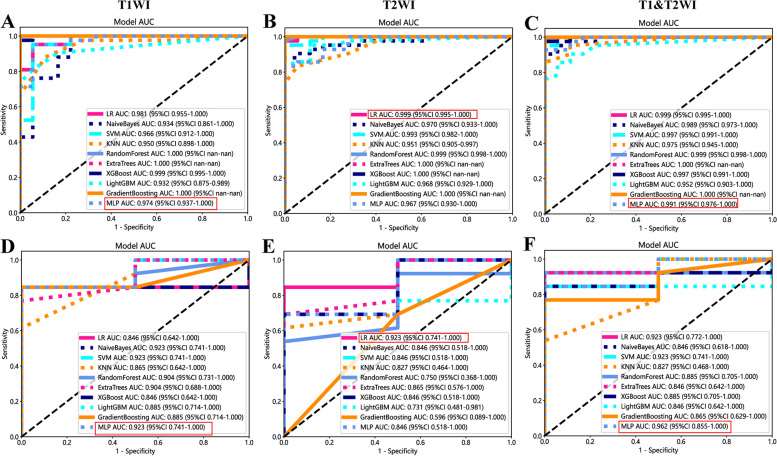
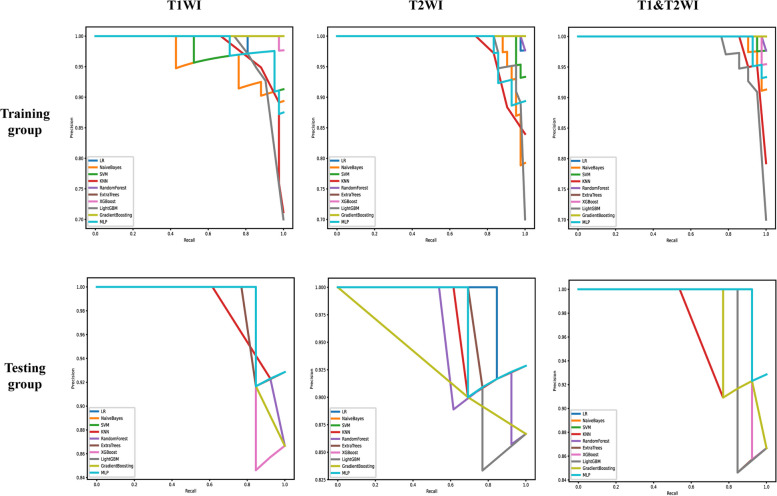
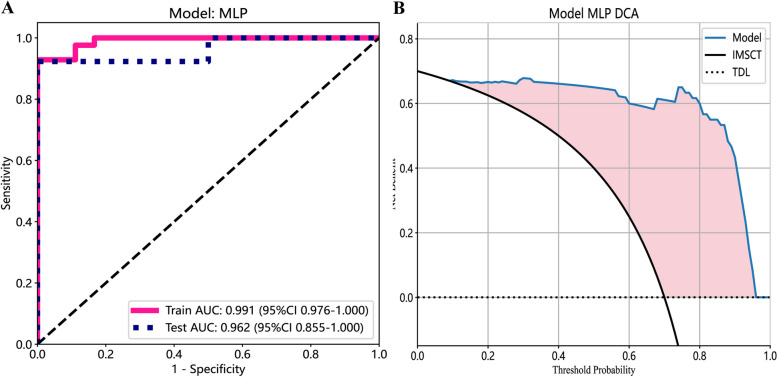
Ten prediction models were generated using ten different classifiers across either or both MRI sequences, as shown in Fig. 6. The AUC values of these 30 models are depicted in a heatmap diagram in Fig. 7, where darker shades represent higher AUC values. The MLP (Multi-Layer Perceptron) model, which integrates both imaging sequences, achieved the highest AUC (Fig. 7). While DeLong's test indicated that the MLP two-sequence model's advantage over the other models was not statistically significant (p > 0.05, Supplementary Table 2), the MLP two-sequence model remained the most effective, as indicated by Precision-Recall curves (Fig. 8), Confusion Matrices (Supplementary Fig. 1), and its highest F1-score and accuracy (Fig. 9). For the training set, the model showed an AUC of 0.991, sensitivity of 92.3%, accuracy of 95.0%, and an F1-score of 96.3%. In the testing set, it achieved an AUC of 0.962, sensitivity of 92.3%, accuracy of 93.3%, Youden's Index of 0.52, specificity of 68.1%, and an F1-score of 96.0%.
Fig. 6.
Receiver operating characteristic curves of different diagnostic models in the training set (A, B and C) and testing set (D, E and F). T1WI (left), T2WI (middle), and T1&T2WI (right). The combined radiomics model of the primary tumor with a 10-mm peritumoral extension (CRprim + 10) reached the highest AUC of 0.995 (95% CI, 0.991–0.999) in the training set and 0.872 (95% CI, 0.847–0.897) in the testing set
Fig. 7.
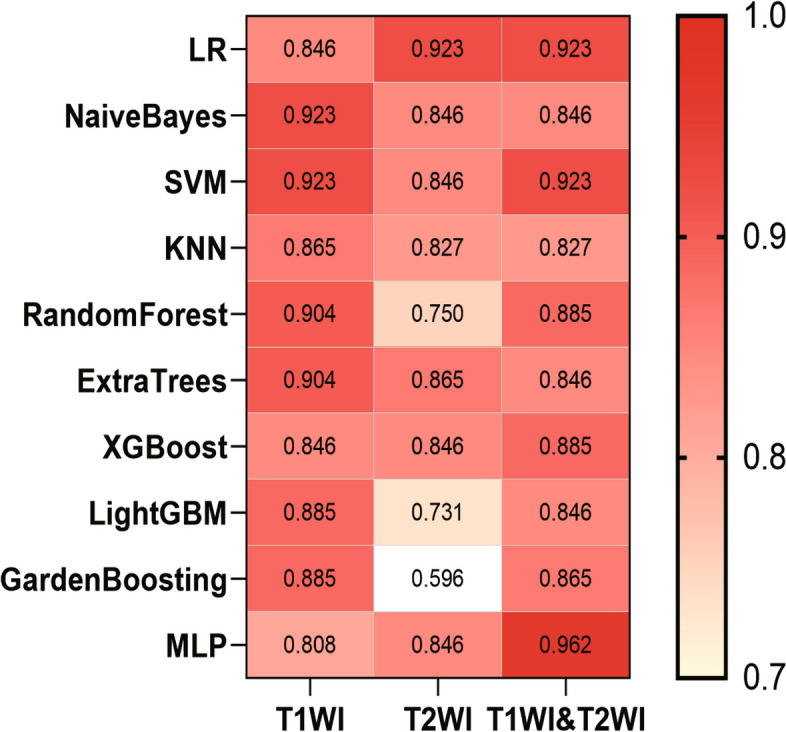
The heatmap of AUC of ten classifiers constructed with different data. A darker color indicates a higher AUC
Fig. 8.
The precision-recall curve of different diagnostic models in the training set and testing set. T1WI (left), T2WI (middle), and T1&T2WI (right). The x-axis represents recall, which indicates how many of the original positive samples were predicted correctly. The y-axis represents precision, which indicates how many of the samples predicted to be positive are positive samples
Fig. 9.
ROC curves (A) and DCA curves (B) of the MLP network classifier
Performance superiority: radiomics model against radiologists' models
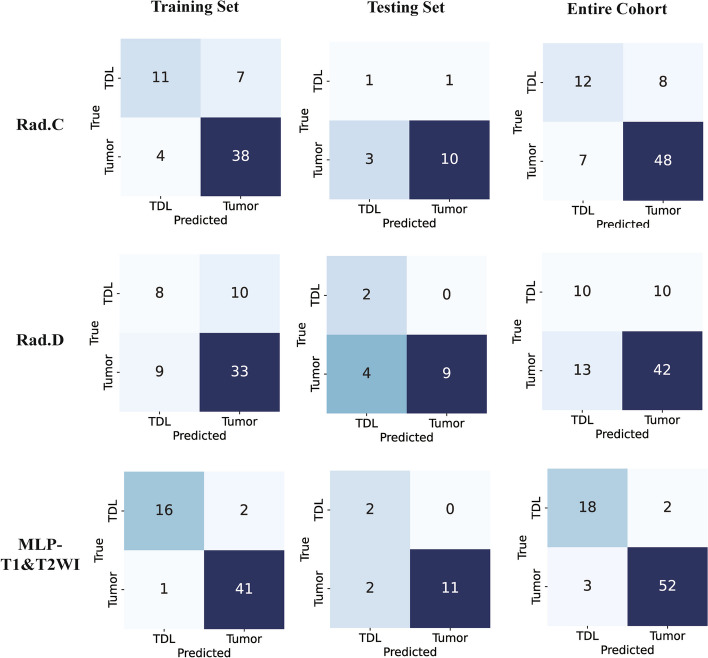
We further opted to employ the MLP two-sequence radiomics model for comparison with the radiologists' diagnoses. First, Kappa analysis determined the good diagnostic agreement between two radiologists, 0.60 to 0.70 in the training group, and 0.70 to 0.75 in the testing group (Supplementary Table 3). DeLong test revealed significant differences favoring the radiomics model over the radiologists' models in the training set and complete cohort (p < 0.05, Table 2 and Fig. 10).
Table 2.
Diagnostic performance of the radiologists and radiomics model
| Training Group | Testing Group | Entire Cohort | |||||||
|---|---|---|---|---|---|---|---|---|---|
| Rad. C | Rad. D | MLP | Rad. C | Rad. D | MLP | Rad. C | Rad. D | MLP | |
| AUC | 0.758 | 0.615 | 0.991 | 0.635 | 0.846 | 0.962 | 0.736 | 0.632 | 0.975 |
| Accuracy | 0.817 | 0.683 | 0.950 | 0.733 | 0.733 | 0.933 | 0.800 | 0.693 | 0.933 |
| F1-score | 0.667 | 0.457 | 0.963 | 0.333 | 0.500 | 0.96 | 0.615 | 0.465 | 0.878 |
| Sensitivity | 0.611 | 0.444 | 0.929 | 0.500 | 1.000 | 0.923 | 0.600 | 0.500 | 0.900 |
| Specificity | 0.905 | 0.786 | 1.000 | 0.769 | 0.692 | 1.000 | 0.873 | 0.763 | 0.945 |
Fig. 10.
Confusion matrices of the radiologists and MLP two-sequence model in training set, testing set, and the entire cohort
Discussion
We developed an MLP two-sequence model, an MRI-based radiomics model, with high efficacy in differentiating IMSCT and scTDL. The superior accuracy, specificity and sensitivity of this model compared to radiologists underscore its potential clinical value. This is the first study employing radiomics models to forecast the diagnosis of intramedullary lesions such as tumors and demyelinating diseases.
MRI represents the key diagnostic assessment in neurological disorders including IMSCT and scTDL. Intramedullary tumors, such as gliomas, and scTDL can appear very similar on MRI, with indistinguishable T1 and T2 signal characteristics. Previous studies have highlighted significant differences between these two lesions in brain in terms of Fractional Anisotropy (FA) and Apparent Diffusion Coefficient (ADC). FA is a measure used in diffusion tensor imaging (DTI) to assess the directionality of water diffusion in tissues, providing insights into the structural integrity of the tissue. ADC, on the other hand, reflects the magnitude of water diffusion, indicating tissue cellularity and integrity. Ducreux et al. [24] observed an average FA value of 0.48 (± 0.02) in five cases of cervical spinal cord astrocytoma, whereas Renoux et al. [25] found an average FA value of 0.588 in inflammatory lesions. Another study reported average FA values of 0.232 (± 0.07) for tumors and 0.39 (± 0.111) for intracranial TDL [26]. These reports indicated that FA tends to be lower in the neoplastic lesion in comparison with the demyelinating insults. ADC values have also been utilized to differentiate between tumors and demyelinating lesions. Marc and his team developed a multi-variable model that includes ADC values, demonstrating an excellent discriminative power (AUC = 0.954–0.986) in distinguishing TDL and glioma [27].
Further efforts to distinguish TDL from tumors have also employed other imaging techniques. For instance, Dae's research highlights that the hypoattenuation observed in computerized tomography (CT) for MR-enhanced lesions offers a high degree of specificity for differentiating between intracranial tumors and TDL [28]. For TDL cases, both MR-enhancing and non-enhancing components showed lower CT attenuation compared to the gray matter in the cortex and basal ganglia. Although tumors frequently exhibited CT hypoattenuation as well, this feature was not present in the MR-enhancing sections [28]. In addition, Satoko et al. employed contrast-enhanced MRI and methionine positron emission tomography (MET-PET) to distinguish brain TDL from tumors, finding that TDL displayed hypometabolism on MET-PET and incomplete ring enhancements on MRI [29]. Further efforts to distinguish TDL from glioma have involved dynamic contrast-enhanced perfusion MRI to assess cerebral blood volume (CBV) and flow (CBF), with demyelinating lesions showing decreased CBV and CBF [30]. Despite these advances, research specifically targeting the differentiation of scTDL from IMSCT is still scarce.
FA and ADC, while useful, have limitations in spinal cord imaging, particularly due to DTI’s lower spatial resolution and susceptibility to artifacts [31]. Our study addresses this by using standard T1- and T2-weighted MRI sequences combined with radiomics features such as shape, texture, and intensity. This approach avoids the technical challenges associated with DTI and advanced imaging techniques, making it more practical for widespread clinical use. Unlike MET-PET, which require specialized equipment, our model can be easily integrated into clinical workflows using conventional MRI, making it a cost-effective and scalable solution for improving diagnostic accuracy in spinal cord lesions.
Radiomics provides a promising approach for characterizing tissue properties using regular CT or MRI imaging. By extracting quantitative features that are undetectable through visual evaluation, radiomics provides an advanced diagnostic method and has been implemented in conditions such as fatty liver and pulmonary nodule, etc. [32, 33]. In the present study, we employed a radiomics method to generate a predictive diagnosis model by analyzing both T1 and T2 MRI images from 75 IMSCT and scTDL individuals. A serial of 9 features including three first-order statistical features, three 3D shape features, two GLSZM features, and one GLDM feature were identified. An MLP model using both sequences were then outstood from 30 models, showing the highest efficacy in differentiating these two lesions.
The finding that the MLP two-sequence model outperformed two junior radiologists is particularly noteworthy as it highlights the potential for this model to assist less experienced clinicians in making more accurate diagnoses. Given the subtle and overlapping imaging characteristics of IMSCT and scTDL, junior radiologists with limited experience in complex spinal cord lesions may struggle to differentiate between these conditions. The model’s ability to surpass their diagnostic accuracy underscores its value as a decision-support tool that can bridge the gap between less experienced and more seasoned clinicians, thereby enhancing diagnostic consistency across different experience levels. Moreover, we used DCA to measure the model's net benefit across various potential risk thresholds. This approach allowed us to examine the effects of different risk thresholds on decision-making. The decision curves demonstrated that employing the prediction model for diagnosing intramedullary conditions proved more advantageous than either universally treating all patients as IMSCT or treating all as scTDL. These results highlight the clinical value of the model, particularly in improving diagnostic accuracy, enhancing decision-making, and optimizing patient management in settings where diagnostic expertise may vary.
The present study developed a predictive model using MRI-based radiomics and MLP classifier that demonstrated high accuracy in distinguishing IMSCT from scTDL. This model’s efficacy in surpassing the diagnostic performance of junior radiologists highlights its potential utility as a non-invasive diagnostic tool for both radiologists and clinicians. Misdiagnosis between these conditions can lead to serious clinical consequences, including unnecessary surgical interventions and complications, as emphasized by previous studies. Clinically, the model provides value not only by supporting radiologists with a more objective, reproducible, and quantitative assessment of imaging features that are difficult to interpret visually but also by assisting clinicians in making informed decisions on patient management.
In clinical practice, this model can be integrated seamlessly into the current diagnostic workflow without the need for significant changes in infrastructure. For example, after routine MRI scans are performed, radiologists can use this model to process the imaging data and generate a radiomics-based diagnostic prediction. Radiologists can then compare the model’s results with their own visual assessments, using the model as a second opinion or as a confirmation in cases where the diagnosis is uncertain or ambiguous. Clinicians, particularly those involved in the treatment of spinal cord lesions, can also use the model’s output to guide clinical decision-making. For instance, in treatment planning, a clear distinction between IMSCT and scTDL is crucial as it dictates very different treatment paths—surgery for IMSCT and medical management for scTDL. However, if relying on CSF diagnosis, the process is invasive and often requires a long waiting period for results. By integrating the model’s results into multidisciplinary discussions between radiologists, neurologists, and surgeons, clinicians can make more informed decisions, improving the accuracy of diagnoses and reducing unnecessary surgical interventions.
Despite these promising results, our study has several limitations. First, the retrospective design may introduce selection bias. Secondly, the MRI images collected in this study were captured using 2 different machines, resulting in potential inconsistencies in data quality. To address this limitation, we standardized imaging procedures and performed ICC analysis to minimize variations across different imaging acquisitions and enhance feature reproducibility [34]. Finally, the dataset was retrospectively compiled from a single center, limiting the diversity of the patient population and thus hinder the universality of our findings.
Conclusion
In this retrospective study, a predictive model based on two-sequence MRI radiomics features and using an MLP classifier showed high efficacy in distinguishing scTDL and IMSCT. Its diagnostic performance was comparable to that of junior radiologists. These findings support the potential for multicenter, prospective studies with larger patient cohorts to further validate this model's clinical utility.
Supplementary Information
Acknowledgements
We extend our special thanks to the physicians in the Department of Radiology at Zhongda Hospital. They not only provided the essential data for this study but also participated in its preliminary processing and analysis. Their professional expertise and selfless contributions were crucial to the successful progression of our research. Additionally, we would like to thank all the staff and support teams involved in this study. Their dedicated efforts ensured the high quality and accuracy of our work.
Abbreviations
- IMSCT
Intramedullary Spinal Cord Tumor
- scTDL
spinal cord Tumefactive Demyelinating Lesion
- LR
Logistic Regression
- NaiveBayes
Naive Bayes
- SVM
Support Vector Machine
- KNN
K Nearest Neighbors
- RF
Random Forest
- ExtraTrees
Extra Trees
- XGBoost
eXtreme Gradient Boosting
- LightGBM
Light Gradient Boosting Machine
- GradientBoosting
Gradient Boosting
- MLP
Multi-Layer Perceptron
- AUC
Area Under the Curve
- MRI
Magnetic Resonance Imaging
- VOI
Volume of Interest
- ICC
Intraclass Correlation Coefficient
- GLCM
Gray Level Co-occurrence Matrix
- GLRLM
Gray Level Run Length Matrix
- GLSZM
Gray Level Size Zone Matrix
- NGTDM
Neighbouring Gray Tone Difference Matrix
- LASSO
Least Absolute Shrinkage and Selection Operator
- ROC
Receiver Operating Characteristic
- DTI
Diffusion tensor imaging
- CT
Computerized Tomography
- MET-PET
Methionine Positron Emission Tomography
- CBV
Cerebral Blood Volume
- CBF
Cerebral Blood Flow
Authors’ contributions
Conceptualization: Zifeng Zhang, Ning Li, Huilin Cheng. Formal Analysis: Zifeng Zhang, Yuhang Qian. Investigation: Zifeng Zhang. Methodology: Zifeng Zhang. Project Administration: Zifeng Zhang. Writing – Original Draft: Zifeng Zhang. Writing – Review & Editing: Zifeng Zhang, Ning Li, Huilin Cheng. Zifeng Zhang and Ning Li contributed equally to this work.
Funding
This study was supported by the National Natural Science Foundation of China (Grant No. 82071393) and the Natural Science Foundation of Jiangsu Province (Grant No. BK20242099).
Data availability
The source code supporting the conclusions of this article is available in the Zenodo repository, accessible via (https://doi.org/10.5281/zenodo.11499435) (https://doi.org/10.5281/zenodo.11499435). The repository ensures open access to the code under the Creative Commons Attribution License, which permits unrestricted use, distribution, and reproduction in any medium, provided the original work is properly cited. Data supporting the findings of this study are not publicly available due to restrictions related to Zhongda Hospital Neurosurgery Department data governance. Further inquiries can be directed to the corresponding author.
Declarations
Ethics approval and consent to participate
Ethical approval was obtained from the Ethics Committee of Southeast University (approval number: 2023ZDSYLL446-P01). Patient informed consent was waived due to the use of anonymous data.
Consent for publication
Consent for publication has been obtained from all participants in this study. All participants signed informed consent forms regarding publishing their data.
Competing interests
The authors declare no competing interests.
Footnotes
Publisher’s Note
Springer Nature remains neutral with regard to jurisdictional claims in published maps and institutional affiliations.
Zifeng Zhang and Ning Li contributed equally to this work.
References
- 1.Goloshchapova K, Goldberg M, Meyer B, Wostrack M, Butenschoen VM. Neurological outcome and respiratory insufficiency in intramedullary tumors of the upper cervical spine. Medicina (Kaunas). 2023;59(10):1754. [DOI] [PMC free article] [PubMed] [Google Scholar]
- 2.Zhang P, Wang G, Sun Z, Lv X, Guo Y, Wang J, Wu Y, Shi W, Zhang H, Liu H, et al. Application of multimodal image fusion to precisely localize small intramedullary spinal cord tumors. World Neurosurg. 2018;118:246–9. [DOI] [PubMed] [Google Scholar]
- 3.Rauschenbach L. Spinal cord tumor microenvironment. Adv Exp Med Biol. 2020;1226:97–109. [DOI] [PubMed] [Google Scholar]
- 4.Oktem IS, Akdemir H, Kurtsoy A, Koc RK, Menku A, Tucer B. Hemilaminectomy for the removal of the spinal lesions. Spinal Cord. 2000;38(2):92–6. [DOI] [PubMed] [Google Scholar]
- 5.Ng Z, Ng S, Nga V, Teo K, Lwin S, Ning C, Yeo TT. Intradural spinal tumors-review of postoperative outcomes comparing intramedullary and extramedullary tumors from a single institution’s experience. World Neurosurg. 2018;109:e229–32. [DOI] [PubMed] [Google Scholar]
- 6.McGirt MJ, Garces-Ambrossi GL, Parker SL, Sciubba DM, Bydon A, Wolinksy JP, Gokaslan ZL, Jallo G, Witham TF. Short-term progressive spinal deformity following laminoplasty versus laminectomy for resection of intradural spinal tumors: analysis of 238 patients. Neurosurgery. 2010;66(5):1005–12. [DOI] [PubMed] [Google Scholar]
- 7.Yuce I, Kahyaoglu O, Cavusoglu HA, Ataseven M, Cavusoglu H, Aydin Y. Surgical treatment and outcomes of intramedullary tumors by minimally invasive approach. J Clin Neurosci. 2021;86:26–31. [DOI] [PubMed] [Google Scholar]
- 8.Lucchinetti CF, Gavrilova RH, Metz I, Parisi JE, Scheithauer BW, Weigand S, Thomsen K, Mandrekar J, Altintas A, Erickson BJ, et al. Clinical and radiographic spectrum of pathologically confirmed tumefactive multiple sclerosis. Brain. 2008;131(Pt 7):1759–75. [DOI] [PMC free article] [PubMed] [Google Scholar]
- 9.Kantorová E, Marcinek J, Zeleňák K, Kantor K, Michalik J, Sivák Š, Kurča E, Plank L. Tumefactive demyelination of the spinal cord: a case report. Spinal Cord. 2015;53(12):877–80. [DOI] [PubMed] [Google Scholar]
- 10.Wingerchuk DM, Banwell B, Bennett JL, Cabre P, Carroll W, Chitnis T, de Seze J, Fujihara K, Greenberg B, Jacob A, et al. International consensus diagnostic criteria for neuromyelitis optica spectrum disorders. Neurology. 2015;85(2):177–89. [DOI] [PMC free article] [PubMed] [Google Scholar]
- 11.van der Velden M, Bots GT, Endtz LJ. Cranial CT in multiple sclerosis showing a mass effect. Surg Neurol. 1979;12(4):307–10. [PubMed] [Google Scholar]
- 12.Yaghi S, Gokdin M, Sethi H. Tumefactive demyelination of the spinal cord. Acta Neurol Belg. 2010;110(2):206–8. [PubMed] [Google Scholar]
- 13.McAdam LC, Blaser SI, Banwell BL. Pediatric tumefactive demyelination: case series and review of the literature. Pediatr Neurol. 2002;26(1):18–25. [DOI] [PubMed] [Google Scholar]
- 14.Noureldine MHA, Shimony N, Jallo GI. Benign Spinal Tumors. Adv Exp Med Biol. 2023;1405:583–606. [DOI] [PubMed] [Google Scholar]
- 15.Passarello K, Kurian S, Villanueva V. Endometrial cancer: an overview of pathophysiology, management, and care. Semin Oncol Nurs. 2019;35(2):157–65. [DOI] [PubMed] [Google Scholar]
- 16.Cai S, Zhang H, Chen X, Wang T, Lu J, Liu X, Zhang G. MR volumetry in predicting the aggressiveness of endometrioid adenocarcinoma: correlation with final pathological results. Acta Radiol. 2020;61(5):705–13. [DOI] [PubMed] [Google Scholar]
- 17.Guo Y, Wang P, Wang P, Gao W, Li F, Yang X, Ni H, Shen W, Guo Z. Myometrial invasion and overall staging of endometrial carcinoma: assessment using fusion of T2-weighted magnetic resonance imaging and diffusion-weighted magnetic resonance imaging. Onco Targets Ther. 2017;10:5937–43. [DOI] [PMC free article] [PubMed] [Google Scholar]
- 18.Joo L, Park JE, Park SY, Nam SJ, Kim YH, Kim JH, Kim HS. Extensive peritumoral edema and brain-to-tumor interface MRI features enable prediction of brain invasion in meningioma: development and validation. Neuro Oncol. 2021;23(2):324–33. [DOI] [PMC free article] [PubMed] [Google Scholar]
- 19.Li G, Li L, Li Y, Qian Z, Wu F, He Y, Jiang H, Li R, Wang D, Zhai Y, et al. An MRI radiomics approach to predict survival and tumour-infiltrating macrophages in gliomas. Brain. 2022;145(3):1151–61. [DOI] [PMC free article] [PubMed] [Google Scholar]
- 20.Tan H, Gan F, Wu Y, Zhou J, Tian J, Lin Y, Wang M. Preoperative prediction of axillary lymph node metastasis in breast carcinoma using radiomics features based on the fat-suppressed T2 sequence. Acad Radiol. 2020;27(9):1217–25. [DOI] [PubMed] [Google Scholar]
- 21.Huang YQ, Liang CH, He L, Tian J, Liang CS, Chen X, Ma ZL, Liu ZY. Development and validation of a radiomics Nomogram for preoperative prediction of lymph node metastasis in colorectal cancer. J Clin Oncol. 2016;34(18):2157–64. [DOI] [PubMed] [Google Scholar]
- 22.Wu S, Zheng J, Li Y, Yu H, Shi S, Xie W, Liu H, Su Y, Huang J, Lin T. A Radiomics Nomogram for the preoperative prediction of lymph node metastasis in bladder cancer. Clin Cancer Res. 2017;23(22):6904–11. [DOI] [PubMed] [Google Scholar]
- 23.Gu Y, She Y, Xie D, Dai C, Ren Y, Fan Z, Zhu H, Sun X, Xie H, Jiang G, et al. A Texture Analysis-Based Prediction Model for Lymph Node Metastasis in Stage IA Lung Adenocarcinoma. Ann Thorac Surg. 2018;106(1):214–20. [DOI] [PubMed] [Google Scholar]
- 24.Ducreux D, Lepeintre JF, Fillard P, Loureiro C, Tadié M, Lasjaunias P. MR diffusion tensor imaging and fiber tracking in 5 spinal cord astrocytomas. AJNR Am J Neuroradiol. 2006;27(1):214–6. [PMC free article] [PubMed] [Google Scholar]
- 25.Renoux J, Facon D, Fillard P, Huynh I, Lasjaunias P, Ducreux D. MR diffusion tensor imaging and fiber tracking in inflammatory diseases of the spinal cord. AJNR Am J Neuroradiol. 2006;27(9):1947–51. [PMC free article] [PubMed] [Google Scholar]
- 26.Liu X, Tian W, Kolar B, Hu R, Huang Y, Huang J, Ekholm S. Advanced MR diffusion tensor imaging and perfusion weighted imaging of intramedullary tumors and tumor like lesions in the cervicomedullary junction region and the cervical spinal cord. J Neurooncol. 2014;116(3):559–66. [DOI] [PubMed] [Google Scholar]
- 27.Mabray MC, Cohen BA, Villanueva-Meyer JE, Valles FE, Barajas RF, Rubenstein JL, Cha S. Performance of Apparent Diffusion Coefficient Values and Conventional MRI Features in Differentiating Tumefactive Demyelinating Lesions From Primary Brain Neoplasms. AJR Am J Roentgenol. 2015;205(5):1075–85. [DOI] [PMC free article] [PubMed] [Google Scholar]
- 28.Kim DS, Na DG, Kim KH, Kim JH, Kim E, Yun BL, Chang KH. Distinguishing tumefactive demyelinating lesions from glioma or central nervous system lymphoma: added value of unenhanced CT compared with conventional contrast-enhanced MR imaging. Radiology. 2009;251(2):467–75. [DOI] [PubMed] [Google Scholar]
- 29.Ninomiya S, Hara M, Morita A, Teramoto H, Momose M, Takahashi T, Kamei S. Tumefactive Demyelinating Lesion Differentiated from a Brain Tumor Using a Combination of Magnetic Resonance Imaging and (11)C-methionine Positron Emission Tomography. Intern Med. 2015;54(11):1411–4. [DOI] [PubMed] [Google Scholar]
- 30.Parks NE, Bhan V, Shankar JJ. Perfusion imaging of tumefactive demyelinating lesions compared to high grade Gliomas. Can J Neurol Sci. 2016;43(2):316–8. [DOI] [PubMed] [Google Scholar]
- 31.Cheng SJ, Tsai PH, Lee YT, Li YT, Chung HW, Chen CY. Diffusion Tensor Imaging of the Spinal Cord. Magn Reson Imaging C. 2021;29(2):195–204. [DOI] [PubMed] [Google Scholar]
- 32.Fujii T, Iizawa Y, Kobayashi T, Hayasaki A, Ito T, Murata Y, Tanemura A, Ichikawa Y, Kuriyama N, Kishiwada M, et al. Radiomics-based prediction of nonalcoholic fatty liver disease following pancreatoduodenectomy. Surg Today. 2024;54:953–63. [DOI] [PubMed] [Google Scholar]
- 33.Ather S, Kadir T, Gleeson F. Artificial intelligence and radiomics in pulmonary nodule management: current status and future applications. Clin Radiol. 2020;75(1):13–9. [DOI] [PubMed] [Google Scholar]
- 34.Schwier M, van Griethuysen J, Vangel MG, Pieper S, Peled S, Tempany C, Aerts H, Kikinis R, Fennessy FM, Fedorov A. Repeatability of multiparametric prostate mri Radiomics features. Sci Rep. 2019;9(1):9441. [DOI] [PMC free article] [PubMed] [Google Scholar]
Associated Data
This section collects any data citations, data availability statements, or supplementary materials included in this article.
Supplementary Materials
Data Availability Statement
The source code supporting the conclusions of this article is available in the Zenodo repository, accessible via (https://doi.org/10.5281/zenodo.11499435) (https://doi.org/10.5281/zenodo.11499435). The repository ensures open access to the code under the Creative Commons Attribution License, which permits unrestricted use, distribution, and reproduction in any medium, provided the original work is properly cited. Data supporting the findings of this study are not publicly available due to restrictions related to Zhongda Hospital Neurosurgery Department data governance. Further inquiries can be directed to the corresponding author.


