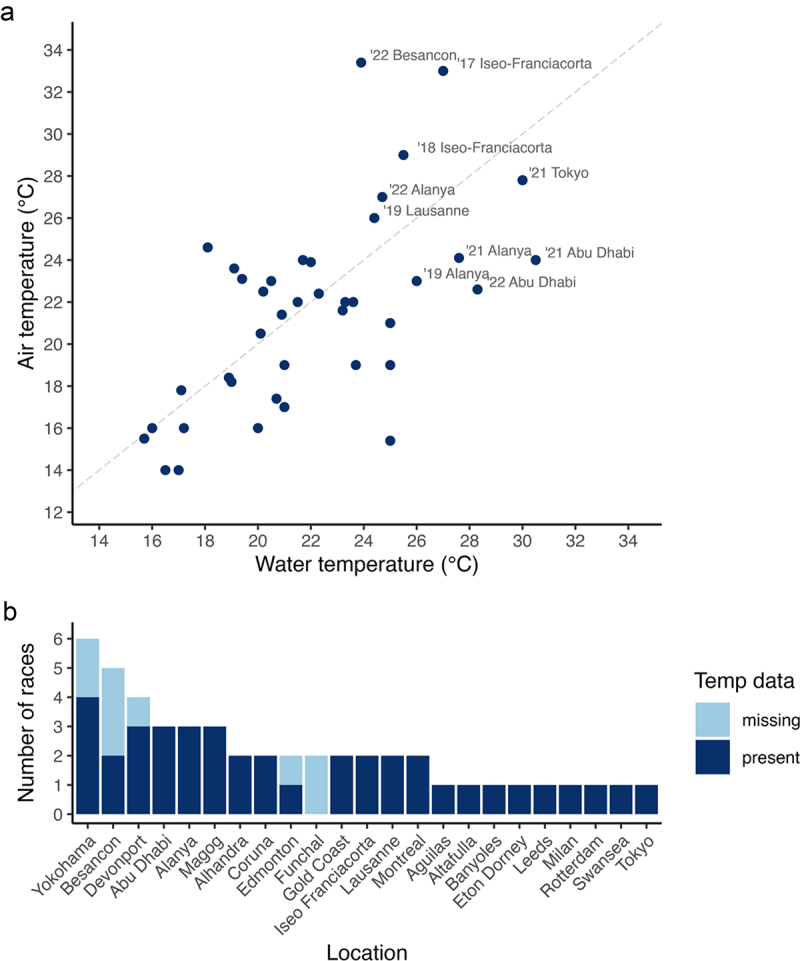
Figure 2.

Water and air temperature from elite wheelchair triathlon events between 2017 and 2023 (panel a) and a summary of races (n = 49) according to location (panel b). In panel A, the dashed line represents the line of identity (r value of 1). Panel a location labels are provided for relatively hotter temperatures. Temp, temperature.
