Figure 4.

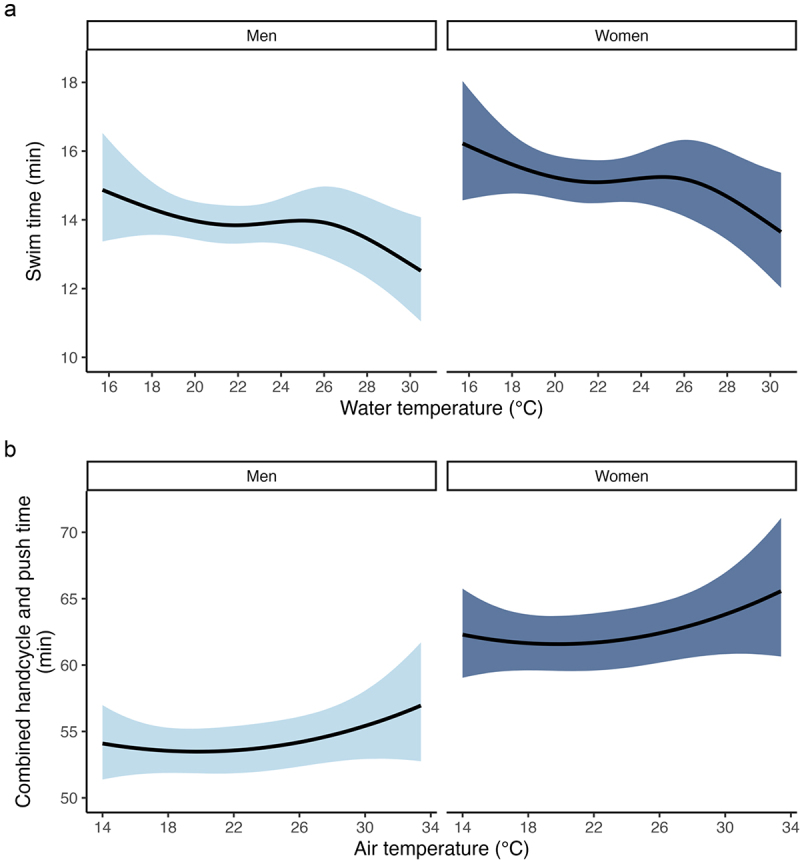
The relationship between water temperature and swim time (panel a) and air temperature and handcycle and push time (panel b). The solid black line indicates the marginal mean, and the ribbon indicates the 95% credible interval.

The relationship between water temperature and swim time (panel a) and air temperature and handcycle and push time (panel b). The solid black line indicates the marginal mean, and the ribbon indicates the 95% credible interval.