Abstract
The absorption of the essential element nitrogen by plants affects various aspects of plant physiological activity, including gene expression, metabolite content and growth. However, the molecular mechanism underlying the potato tuberization response to nitrogen remains unclear. Potato plants were subjected to pot experiments under nitrogen deficiency, normal nitrogen levels and nitrogen sufficiency. A comprehensive analysis of the physiological responses, transcriptomic profiles, and metabolic pathways of potato stolons subjected to nitrogen stress was conducted. Transcriptomic analysis revealed 2756 differentially expressed genes (DEGs) associated with nitrogen stress. Metabolomic analysis identified a total of 600 differentially accumulated metabolites (DAMs). Further correlation analysis of the major DEGs and DAMs revealed that 9 key DEGs were associated with alpha-linolenic acid metabolism, 16 key DEGs with starch and sucrose metabolism, 7 key DEGs with nitrogen metabolism, and 16 key DEGs with ABC transporters. Nitrogen deficiency significantly increased the sucrose, GDP-glucose and L-glutamic acid levels and promoted stolon growth by increasing the expression of AMY (alpha-amylase), BE (1,4-alpha-glucan branching enzyme), SS (starch synthase), SPS (sucrose‒phosphate synthase) and AGPS (glucose‒1-phosphate adenylyltransferase). However, high nitrogen levels had the opposite effect. In addition, high nitrogen levels upregulated EG (endoglucanase), SUS (sucrose synthase) and GDH (glutamate dehydrogenase) and led to significant accumulation of 9-Hydroperoxy-10,12,15-octadecatrienoate (9(S)-HpOTrE), (13 S)-Hydroperoxyoctadeca-9,11,15-trienoate (13 (S)-HpOTrE) and L-glutamine, ultimately affecting the balance between plant growth and defense. Overall, our comprehensive study revealed the co-expressed genes and potential pathways related to potato tuber formation under different nitrogen conditions. These data provide a better understanding needed for improving potato tuber traits at the molecular and metabolic levels.
Supplementary Information
The online version contains supplementary material available at 10.1186/s12870-024-05758-2.
Keywords: Nitrogen, Potato, Tuber formation, Transcriptome, Metabolome
Introduction
As the fourth most widely grown food crop in the world, the potato (Solanum tuberosum L.) takes up a significant cultivation area, and its cultivation is fertilizer-intensive; the amount of potatoes consumed directly by humans is second only to that of rice and wheat [1]. Potatoes are rich in not only starch but also vitamin C, vitamin B6, vitamin A and more than ten other vitamins, phenolic compounds, potassium and other mineral nutrients [2]. It also contains 8 essential amino acids, including lysine and tryptophan, making it an excellent dietary source of these nutrients [3]. Therefore, improving cultivation technology and production levels is highly important for the development of the potato industry.
Potato tubers are formed by the expansion of the top of the plant stolons [4]. Given that tubers are economically important organs of potato plants, their formation time and growth process are related to the final yield. Therefore, the potato tuber formation process and mechanism have been a research focus for botanists. Nitrogen is an integral component of numerous cellular constituents [5] and an essential nutrient element for plant growth and development, so nitrogen application is a very important agronomic measure in potato production. However, there has been an increased focus on the relationship between nitrogen nutrition and tuber yield as well as the enhancement of nitrogen fertilizer efficiency [6]. Conversely, there has been a paucity of attention devoted to the impact of nitrogen as a stimulant on potato tuber formation. Tuber formation is the basis of tuber expansion and yield formation in the late stage of growth [7]. Studying the effects of nitrogen on tuber formation is important for optimizing the fertilization time, controlling fertilization rates during different periods and improving nitrogen use efficiency.
Numerous studies have shown that low nitrogen concentrations are more conducive to the formation of potato tubers than high nitrogen concentrations are [8]. In addition, tissue culture experiments have shown that tuber formation occurs significantly earlier under a low nitrogen supply than under a high nitrogen supply [9]. At the initial stage of potato tuber formation, StBEL5 and POTH1 interact in leaves to induce tuber formation by inducing the expression of StSP6 A and StCDF1 and then regulating multiple downstream tuber formation-related genes [10]. Research has shown that nitrogen regulates starch synthesis by affecting the overall activity of uridine-5-diphosphoglucose pyrophosphorylase and ultimately affects tuber formation [11]. The effect of nitrogen on tuber development may be achieved through the regulation of C/N. Low nitrogen levels can increase the C/N ratio in tubers and promote tuber formation. In contrast, high nitrogen levels can reduce the C/N ratio in tubers and inhibit tuber formation [12]. The formation of tubers is also regulated by the form of the nitrogen. Nitrate nitrogen (NO3−-N) promotes the formation of more tubers, whereas ammonium nitrogen (NH4+-N) is more conducive to the early formation of tubers [13, 14]. Furthermore, a suitable NH4+-N and NO3−-N ratio could promote the formation of tubers and the accumulation of glucose, sucrose and starch in tubers [15]. These studies provide a basis for understanding the effects of different nitrogen concentrations on potato tuber formation. Previous studies have provided preliminary insights into the process by which nitrogen regulates potato tuber formation. However, the underlying molecular mechanism involved in the response of potato tubers to nitrogen remains unclear. Therefore, it is crucial to conduct further investigations into the alterations in genes and metabolites within the potato stolon as well as to elucidate the molecular mechanisms underlying the response of potato tubers to varying nitrogen concentrations.
To date, the molecular response of potatoes to nitrogen during development, from stolons to tubers, has rarely been studied. Consequently, we used physiological analysis, RNA sequencing (RNA-Seq) and nontargeted metabolomics to analyze the mechanism underlying the response of potato stolons to different nitrogen concentrations. The purpose of this study was to determine the phenotypic and physiological changes in potato plants under different nitrogen concentrations. Differentially expressed genes (DEGs), differentially accumulated metabolites (DAMs) and their key pathways were identified, and the molecular mechanism underlying the response of potato stolons to different nitrogen concentrations was revealed. Our study elucidated the molecular mechanisms by which potato plants respond to various nitrogen concentrations during development from stolons to tubers.
Materials and methods
Plant materials and experimental treatments
The experiment was performed at the potted planting field in the Keshan Branch of the Heilongjiang Academy of Agricultural Sciences in Northeast China (125°87′E, 48°03′N), in 2023 (conditions: 60% relative humidity, 14 h light/10 h dark). The potato variety Kexin13 (with a growth period of 97 days) was obtained from the Keshan Branch Potato Breeding Research Institute at Heilongjiang Academy of Agricultural Sciences. Seeds were sown on May 10 and reached the early stage of tuber formation 25 days after sowing. The average temperature was 19.98 °C during the experiment. The selected seeds were all virus-free mini-tubers. One seed was planted in each resin pot (with an upper diameter of 32 cm, a lower diameter of 25 cm, and a height of 30 cm with 10 holes in the bottom), and each pot was filled with approximately 15 kg of black soil. The mineral composition of black soil is as follows: clay, 34.65%; silt, 46.13%; and sand, 19.22%. The soil fertility levels are shown in Table 1. Regular water irrigation (80% relative soil water content) was applied until the plants reached maturity. The potato cultivars were divided into the AN0 (nitrogen deficiency), AN1 (normal nitrogen level, CK) and AN2 (nitrogen sufficiency) groups for nitrogen treatment, with 60 pots in each treatment group. Each plant in the AN0 group was treated with 0 g of urea, 4.5 g of concentrated superphosphate (P2O5: 46%), and 6 g of potassium sulfate (K2O: 50%). Each plant in the AN1 group was treated with 6.52 g of urea (N: 46%), 4.5 g of concentrated superphosphate (P2O5: 46%), and 6 g of potassium sulfate (K2O: 50%). Each plant in the AN2 group was treated with 13.04 g of urea (N: 46%), 4.5 g of concentrated superphosphate (P2O5: 46%), and 6 g of potassium sulfate (K2O: 50%). The AN1 treatment group was selected as the sampling time standard, and samples were taken when the plants in this group reached the initial stage of subapical stolon enlargement (after a growth stage of 25 days). Fresh stolons from Kexin13 plants were selected for transcriptomic and metabolomic measurements. The same number of leaves was selected for the determination of physiological indexes. For quantitative real-time PCR (qRT-PCR) validation, fresh stolons from Kexin13 plants were sampled in tubes, frozen in liquid nitrogen, and then stored at − 80 °C until analysis.
Table 1.
Soil fertility levels
| Organic matter g/kg |
Total nitrogen (N) % |
Total phosphorus (P) % |
Total potassium (K2O) % |
Hydrolytic nitrogen (N) mg/kg |
Available phosphorus (P) mg/kg |
Available potassium (K2O) mg/kg |
pH |
|---|---|---|---|---|---|---|---|
| 86.4 | 0.206 | 0.032 | 2.05 | 194.4 | 12.2 | 299 | 6.53 |
Physiological and biochemical parameter assays
Six plants from each treatment group were chosen at random. The heights of the potato plants were measured using a meter stick (Qinghai, China). Moreover, the chlorophyll a (Chl a), chlorophyll b (Chl b), carotenoid (Car), total chlorophyll (Chl a + b), and dry matter contents of the tubers, roots, shoots, and leaves were determined using a previously reported method [16]. The total nitrogen content was determined with the Kjeldahl method [17]. The nitrogen accumulation in the plants was calculated according to the following formula: plant nitrogen accumulation (g) = plant nitrogen content × plant dry matter weight.
Determining the ultrastructures of potato stolon cells
The potato stolon tissue was immediately placed in 2.5% glutaraldehyde for fixation; after 2 h, the tissue was washed with 0.1 mol/L phosphate-buffered saline (PBS, pH 7.2) 3 times for 15 min each time. Then, the cells were fixed with 1% OsO4 and washed with PBS after 2 h. After dehydration with gradient concentrations of ethanol, propylene oxide transition, epoxy resin infiltration and embedding, the embedded blocks were polymerized and cut into 50–70 nm sections on an Ultra-Jung ultrathin slicer. The sections were double stained with uranyl acetate and lead citrate. Finally, the samples were observed and photographed under a Philips Tecnai12-TWIN transmission electron microscope.
Transcriptomic analysis
Fresh stolon samples from N0, N1 and N2 were used for transcriptomic profiling analysis, with three biological replicates per treatment. Total RNA was isolated from the samples using TRIzol reagent (Invitrogen, CA, USA) according to the manufacturer’s instructions. RNA purity and quantity were evaluated with a NanoDrop 2000 spectrophotometer (Thermo Scientific, USA). RNA integrity was assessed via an Agilent 2100 Bioanalyzer (Agilent Technologies, Santa Clara, CA, USA). The libraries were subsequently constructed using the VAHTS Universal V6 RNA-seq Library Prep Kit according to the manufacturer’s instructions. Transcriptome sequencing and analysis were conducted by OE Biotech Co., Ltd. (Shanghai, China).
The libraries were sequenced on an Illumina NovaSeq 6000 platform, and 150 bp paired-end reads were generated. Raw reads in fastq format were first processed using fastp [18], and the low-quality reads were subsequently removed to obtain a clean set of reads for subsequent analyses. The clean reads were mapped to the Solanum tuberosum L. reference genome using HISAT2 [19]. The Fragments Per Kilobase Million (FPKM) value of each gene was calculated [20], and the read counts of each gene were obtained via HTSeq-count [21]. P values < 0.05 and |log2-fold changes| > 1 were used as the thresholds for differential expression. The specific steps used for data processing were performed as previously described [22].
Metabolomic analysis
Sample preparation
Fresh stolon samples from AN0, AN1, and AN2 were selected for metabolomic analysis, with six biological replicates per treatment. Sixty milligrams of sample was weighed into a 1.5 mL centrifuge tube, and two small steel balls and 600 µL of a methanol-water mixture (V: V = 7:3, containing a mixed internal standard, 4 µg/mL) were added. After precooling in a freezer at -40 °C for 2 min, the samples were ground in a grinder (60 Hz, 2 min). Ultrasonic extraction was performed in an ice water bath for 30 min, and the mixture was incubated at -40 °C overnight. The samples were subsequently centrifuged at 4 °C (13000 rpm) for 10 min. The supernatants (150 µL) from each tube were collected with crystal syringes, filtered through 0.22 μm microfilters and transferred to liquid chromatography (LC) vials. The vials were stored at -80 °C until liquid chromatography‒mass spectrometry (LC‒MS) analysis. Quality control (QC) samples were prepared by mixing aliquots of all the samples as pooled samples.
Sample preparation and metabolomic data analysis were performed at Shanghai Ouyi Biomedical Technology Co., Ltd. (Shanghai, China) according to standard procedures. Chromatographic separation was achieved via a Waters ACQUITY UPLC HSS T3 column (100 mm×2.1 mm, 1.8 μm), and the mobile phases were water containing 0.1% formic acid (phase A) and acetonitrile containing 0.1% formic acid (phase B). The phase A/phase B ratios during the gradient program were as follows: 95:5 (v/v) at 0 min, 98:5 (v/v) at 2 min, 0:100 (v/v) at 14 min, 0:100 (v/v) at 15 min, 95:5 (v/v), at 15.1 min and 98:5 (v/v) at 16 min. The flow rate was 0.35 mL/min, and the injection volume was 3 µL. Metabolite extraction and analysis were performed according to the methods of Zhou et al. [23].
Metabolomic data preprocessing and statistical analysis
The original LC‒MS data were processed with Progenesis QI V2.3 software (Nonlinear, Dynamics, Newcastle, UK) for baseline filtering, peak identification, integration, retention time correction, peak alignment, and normalization. The main parameters applied here were as follows: 5 ppm precursor tolerance, 10 ppm product tolerance, and 5% product ion threshold. The compounds were identified on the basis of the precise mass-charge ratio (M/z), secondary fragments, and isotopic distribution using the Human Metabolome Database (HMDB), Lipidmaps (V2.3), Metlin, and custom-built databases. The extracted data were then further processed by removing any peaks with a missing value (ion intensity = 0) in more than 50% of the groups, replacing the zero value with half of the minimum value, and screening according to the qualitative results for the compound. Compounds with scores below 36 (out of 60) points were also deemed inaccurately identified and removed. A combined data matrix was generated from the positive and negative ion data.
The matrix was imported into R to perform principal component analysis (PCA) to determine the overall distribution among the samples and the stability of the whole analysis process. Orthogonal partial least-squares-discriminant analysis (OPLS-DA) and partial least-squares-discriminant analysis (PLS-DA) were used to distinguish the metabolites that differed between groups. To prevent overfitting, 7-fold cross-validation and 200 response permutation tests (RPTs) were used to evaluate the quality of the model. Variable importance in projection (VIP) values obtained from the OPLS-DA model were used to rank the overall contribution of each variable to group discrimination. A two-tailed Student’s t test was further used to verify whether the metabolites with differences between groups were significant. DAMs with VIP values greater than 1.0 and p values less than 0.05 were selected. These DAMs were further used for Kyoto Encyclopedia of Genes and Genomes (KEGG) pathway (http://www.genome.jp/kegg/) enrichment analysis.
Quantitative real-time PCR (qRT‒PCR) analysis
Seven DEGs were selected for qRT‒PCR analysis, and glyceraldehyde-3-phosphate dehydrogenase (GAPDH) was used as an internal reference gene. The primer sequences were designed in the laboratory and synthesized by TsingKe Biotech on the basis of the mRNA sequences obtained from the NCBI database (Table S9). qRT‒PCR was performed using a LightCycler® 480II real-time PCR instrument (Roche, Switzerland). The 2−ΔΔCt method was used to calculate the relative expression levels of the genes [24]. The qRT‒PCR results confirmed that the RNA-seq data (R2 = 0.7992) were reliable (Fig. S1).
Measurement of yield and yield components
Ten mature potato plants were randomly selected from each treatment group to determine the number of tubers per plant and the fresh tuber weight per plant.
Statistical analysis
One-way analysis of variance was performed on all collected data using Microsoft Excel 2013, Origin 2021 and SPSS 26.0. The differences among the treatments were tested via the Duncan test (p < 0.05), and the differences among the different materials were statistically significant.
Results
Effects of different nitrogen treatments on the morphology of potato plants
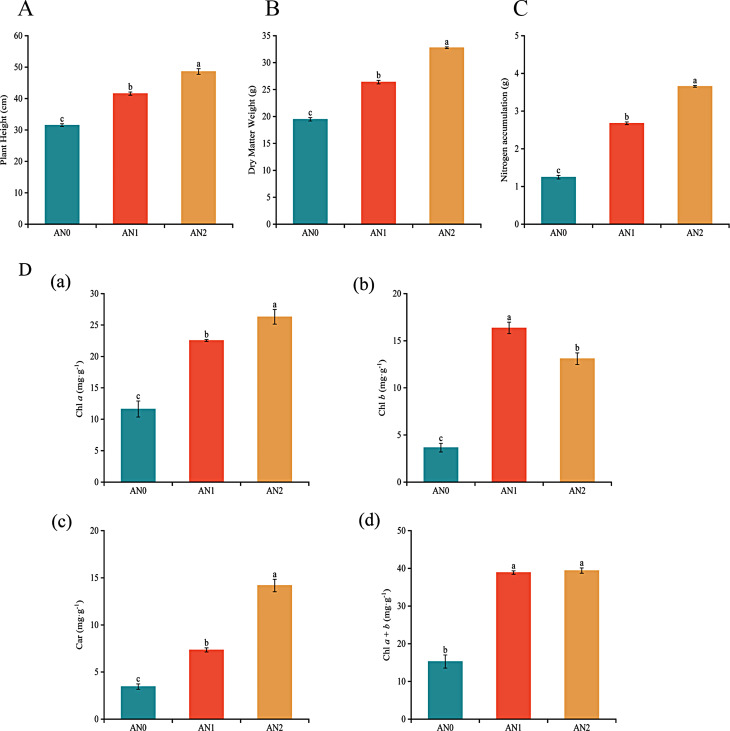
The plant height, dry matter weight, nitrogen accumulation level and leaf photosynthetic pigment content of the potato cultivar Kexin 13 under the AN0, AN1 and AN2 treatments were measured (Fig. 1). The plant height, dry matter weight, nitrogen accumulation, and Chl a, Chl b, Car, and Chl a + b contents significantly decreased by 24.15%, 26.22%, 53.42%, 48.42%, 77.64%, 52.95% and 60.70%, respectively, in the AN0 treatment group relative to those in the AN1 group. However, the change in the morphological index under high nitrogen levels was the opposite to that under low nitrogen levels. Specifically, the plant height, dry matter weight, nitrogen accumulation, Chl a, and CAR contents significantly increased by 16.91%, 24.81%, 36.61%, 16.73%, and 93.06%, respectively, in the AN2 treatment group relative to those in the AN1 group.
Fig. 1.
Effects of different nitrogen concentrations on (A) plant height, (B) dry matter weight per plant, (C) nitrogen accumulation, and (D) leaf photosynthetic pigment content. All the data are expressed as the means ± SEs, n = 3. According to Duncan’s test, the different lowercase letters indicate significant differences between treatments (P < 0.05)
Ultrastructure of potato stolons
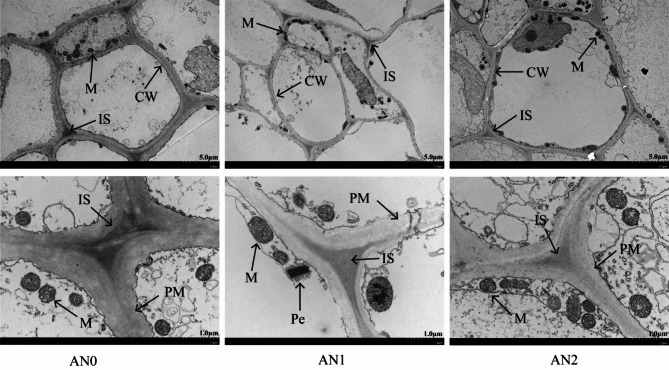
Figure 2 shows that in the AN1 group, the plasma membrane and cell wall of the potato stolons were robust, the mitochondrial bilayer membrane structure was intact and mostly spherical or ellipsoidal, and the internal ridge structure was clearly visible. However, compared with those in AN0, the number of mitochondria in potato stolons increased in AN1, the cell wall and plasma membrane became thinner, and the intercellular space decreased in plants in the AN2 treatment group. This result indicated that excessive nitrogen inhibited the formation of potato tubers, whereas low nitrogen levels accelerated the transformation of stolons to tubers.
Fig. 2.
Ultrastructural changes in potato stolon cells under different nitrogen concentrations. CW: cell wall, PM: plasma membrane, M: mitochondrion, IS: intercellular space, and Pe, peroxisome
Transcriptomic analysis
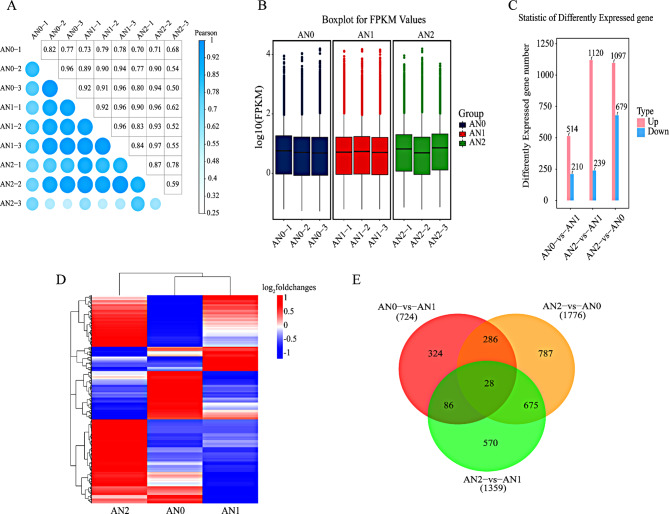
To determine the molecular effects of the potato tuber formation response to nitrogen, the transcriptomes of the potato stolons were analyzed. A total of 428.27 M clean reads were obtained from each sample (Table S1). The GC content of all the clean reads was greater than 43.80%, and the Q30 value was greater than 93.32%. The mapping rate of the clean reads of all the samples to the reference genome sequence ranged from 88.61 ~ 90.69%, and a total of 25,702 genes were found. Pearson correlation coefficient analysis verified the biological consistency among the samples (Fig. 3A), and the dispersion of the data distribution was better (Fig. 3B). Totals of 724 (514 up- and 210 downregulated), 1359 (1120 up- and 239 downregulated), and 1776 (1097 up- and 679 downregulated) DEGs were identified by comparing AN0 vs. AN1, AN2 vs. AN1, and AN2 vs. AN0, respectively (Fig. 3C). An overview of the expression profiles of all the identified DEGs is shown in the heat map in Fig. 3D. A total of 2756 DEGs were identified in the three comparison groups (Table S2). The common and unique DEGs between the different comparison groups are shown in a Venn diagram (Fig. 3E). A total of 324 DEGs were unique to the AN0 and AN1 comparison groups, 570 DEGs were unique to the AN2 vs. AN1 comparison group, 787 DEGs were unique to the AN2 vs. AN0 comparison group, and 28 DEGs were shared by the three comparison groups.
Fig. 3.
Transcriptomic data on potato stolons in the different treatment groups under nitrogen stress. (A) Pearson correlation coefficient analysis. The abscissa and ordinate represent the sample names, and the color represents the correlation coefficient. (B) Box plot of the FPKM values. The abscissa represents the sample name, and the ordinate represents the commonly used logarithmic transformation value of the FPKM, i.e., log10 (FPKM). The box plot of each region corresponds to five statistics (maximum, third quartile, median, first quartile and minimum from top to bottom). (C) Analysis of DEG numbers. The abscissa represents each comparison group, and the ordinate represents the number of DEGs in the comparison group, where Up represents the number of upregulated genes with significant differences and Down represents the number of downregulated genes with significant differences. (D) Heat maps of DEGs compared between different groups. Red represents relatively highly expressed genes, blue represents relatively poorly expressed genes, and genes that met the P < 0.05 and |log2-fold change|>1 thresholds were defined as DEGs. (E) Venn diagram of DEGs
GO and KEGG pathway analysis of DEGs
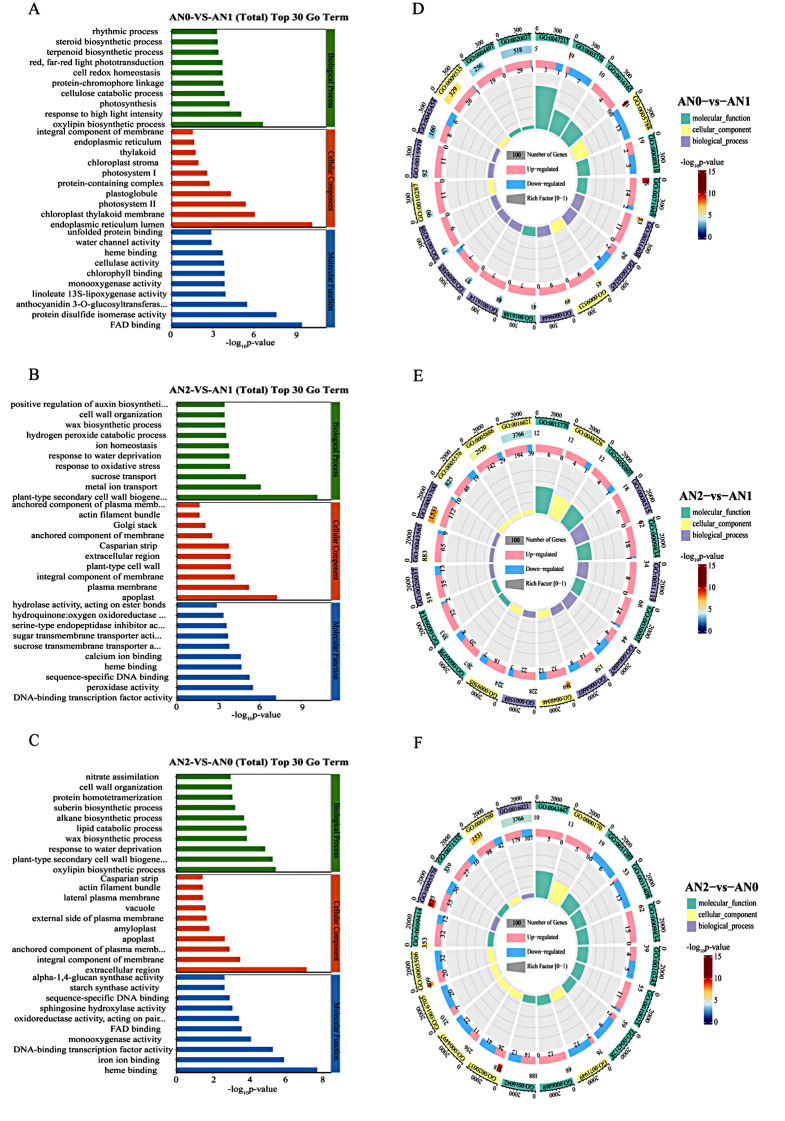
The GO terms were enriched in three functional categories: molecular function (MF), cellular component (CC) and biological process (BP). The top 10 enriched GO terms from the three categories and across different comparisons are shown in Fig. 4 (Table S3). In the AN0 vs. AN1 comparison, oxylipin biosynthetic process (GO:0031408), response to high light intensity (GO:0009644) and photosynthesis (GO:0015979) were the main enriched terms in the BP category; endoplasmic reticulum lumen (GO:0005788), chloroplast thylakoid membrane (GO:0009535) and photosystem II (GO:0009523) were the main enriched terms in the CC category; and FAD binding (GO:0071949), protein disulfide isomerase activity (GO:0003756) and anthocyanidin 3-O-glucosyltransferase activity (GO:0047213) were the main enriched terms in the MF category (Fig. 4A, D). In the AN2 vs. AN1 comparison, plant-type secondary cell wall biogenesis (GO:0009834), metal ion transport (GO:0030001) and sucrose transport (GO:0015770) were the main enriched terms in the BP category; apoplast (GO:0048046) and plasma membrane (GO:0005886) were the main enriched terms in the CC category; and DNA-binding transcription factor activity (GO:0003700) and peroxidase activity (GO:0004601) were the main enriched terms in the MF category (Fig. 4B, E). In the AN2 vs. AN0 comparison, oxylipin biosynthetic process (GO:0031408) and plant-type secondary cell wall biogenesis (GO:0009834) were the main enriched terms in the BP category; extracellular region (GO:0005576) and integral component of membrane (GO:0016021) were the main enriched terms in the CC category; and heme binding (GO:0020037) and iron ion binding (GO:0005506) were the main enriched terms in the MF category (Fig. 4C, F).
Fig. 4.
Analysis of GO pathway enrichment of DEGs in different comparison groups. A-C: GO enrichment analysis top30 bar chart. The ordinate represents the name of the GO term, and the abscissa shows the negative common logarithm of the P value derived from enrichment analysis, i.e., the -log10-P value, for each annotation. D-F: GO enrichment analysis circle diagram shows the 20 categories with the smallest q value or p value, with a total of four circles from outside to inside. The first circle: enriched classification; the coordinate scale of the gene number is shown outside the circle. Different colors represent different classifications; the second circle represents the number of classifications for the background gene and the q value or p value. The greater the number of stripes is, the longer the gene; the smaller the value is, the redder the color; and the larger the value is, the bluer the color. The third circle: upregulated and downregulated gene ratios in the bar chart, light red represents the proportion of upregulated genes, and light blue represents the proportion of downregulated genes; the specific values are shown below. The fourth circle represents the Rich factor value of each classification (the number of foreground genes in the classification is divided by the number of background genes), and each small grid of the background auxiliary line represents 0.2
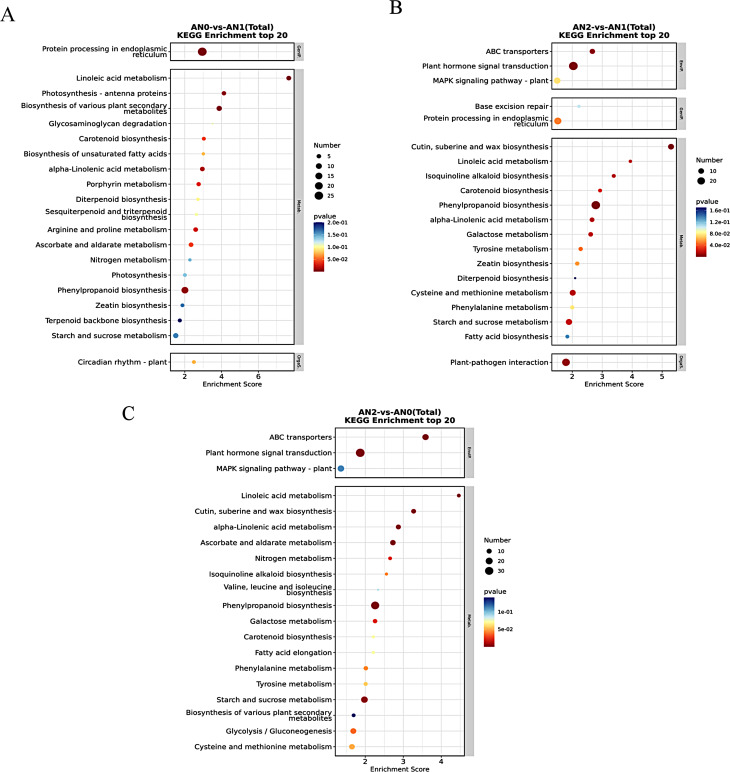
The biological functions of the DEGs were further analyzed via KEGG pathway enrichment (Fig. 5). In the AN0 vs. AN1 comparison, several pathways, including protein processing in the endoplasmic reticulum, linoleic acid metabolism, biosynthesis of various plant secondary metabolites, photosynthesis-antenna proteins and phenylpropanoid biosynthesis, were significantly enriched (p < 0.01) (Fig. 5A). In the AN2 vs. AN1 comparison, the phenylpropanoid biosynthesis, cutin, suberin and wax biosynthesis, plant hormone signal transduction, ABC transporter and plant-pathogen interaction pathways were significantly enriched (p < 0.01) (Fig. 5B). The ABC transporter, ascorbate and aldarate metabolism, alpha-linolenic acid metabolism, phenylpropanoid biosynthesis, cutin, suberin and wax biosynthesis, plant hormone signal transduction, linoleic acid metabolism, and starch and sucrose metabolism pathways were significantly enriched in AN2 vs. AN0 (p < 0.01) (Fig. 5C).
Fig. 5.
KEGG pathway enrichment analysis of DEGs in different comparison groups. A-C: KEGG enrichment analysis of top20 bubble diagram. The ordinate denotes the statistical results of the DEGs in each KEGG pathway. The abscissa represents the enrichment score. The bubble size represents the number of DEGs, and the bubble color gradient represents the magnitude of the p value. The larger the bubble is, the greater the number of differentially expressed protein-coding genes; the bubble color changes from blue to white to yellow to red. The smaller the enrichment p value is, the greater the significance
Metabonomic analysis
To explore the metabolic variations in potato tuber formation after treatment with different nitrogen levels, untargeted metabolomic analysis was conducted on six independent biological replicates of AN0, AN1 and AN2; conventional nitrogen level treatment served as a control.
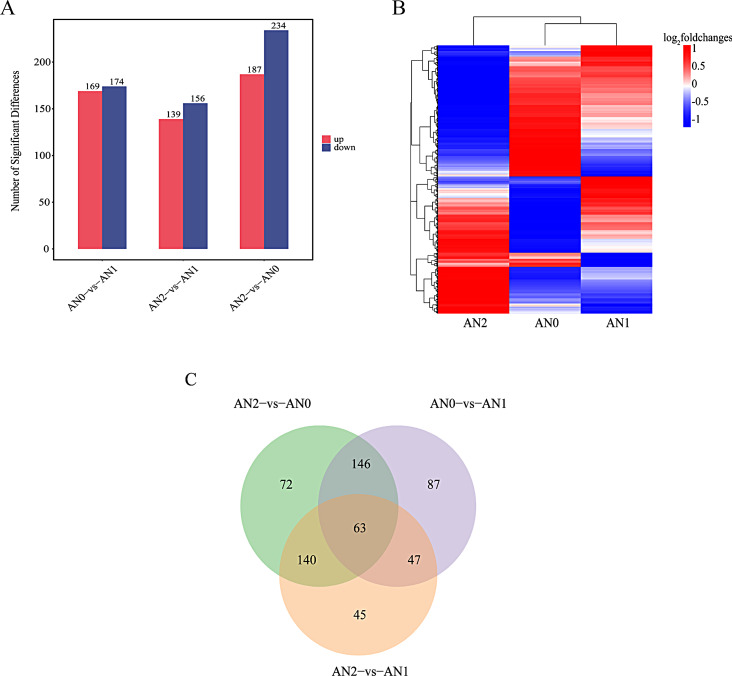
A total of 600 DAMs were screened out in the three comparison groups (Table S4). A PCA of the metabolite content revealed clear separation among the three samples (Fig. S2). This finding suggested that VIP analysis could be used to screen for DAMs. By using the criteria VIP > 1 and p < 0.05, numerous DAMs were identified in the different comparisons, including 169 upregulated and 174 downregulated DAMs in the AN0 vs. AN1 comparison, 139 upregulated and 156 downregulated DAMs in the AN2 vs. AN1 comparison, and 187 upregulated and 234 downregulated DAMs in the AN2 vs. AN0 comparison (Fig. 6A). An overview of the metabolite profiles of potatoes following treatment with different nitrogen levels is shown in Fig. 6B. A Venn diagram of the DAMs revealed that 72 DAMs were unique to the AN0 vs. AN1 comparison group, 45 DAMs were unique to the AN2 vs. AN1 comparison group, 87 DAMs were unique to the AN2 vs. AN0 comparison group, and 63 DAMs were shared among the three comparison groups (Fig. 6C).
Fig. 6.
Metabolite analysis of nitrogen stress in potato stolons among the different treatment groups. (A) Analysis of the number of DAMs. The abscissa represents each comparison group, and the ordinate represents the DAMs of the comparison group, where Up is the number of upregulated metabolites with significant differences and Down is the number of downregulated metabolites with significant differences. (B) Heat maps of DAMs in different comparison groups. The abscissa represents the sample name, and the ordinate represents the DAMs. A change in color from blue to red indicates the abundance of the metabolite changing from low to high; that is, the redder the color is, the higher the abundance of the differentially abundant metabolites; metabolites that meet the P < 0.05 and VIP > 1 thresholds are defined as DAMs. (C) Venn diagram of DAMs
KEGG pathway analysis of DAMs
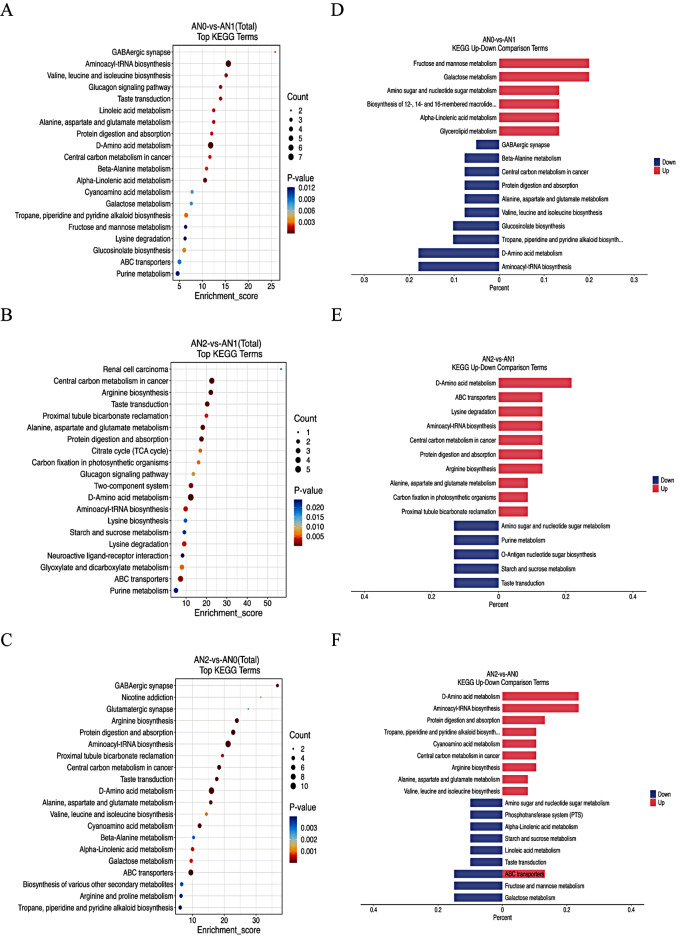
The top 20 KEGG terms are shown in Fig. 7A, B, and C. Aminoacyl-tRNA biosynthesis; valine, leucine and isoleucine biosynthesis; D-amino acid metabolism; and alpha-linolenic acid metabolism were the most significantly enriched terms in the AN0 vs. AN1 comparison group. In the AN2 vs. AN1 comparison, D-amino acid metabolism, central carbon metabolism in cancer, arginine biosynthesis, ABC transporters and starch and sucrose metabolism were the main significantly enriched terms (Fig. 7B). However, in the AN2 vs. AN0 comparison, the most enriched terms were aminoacyl-tRNA biosynthesis, D-amino acid metabolism, protein digestion and absorption, arginine biosynthesis, ABC transporters and alpha-linolenic acid metabolism (Fig. 7C).
Fig. 7.
KEGG pathway enrichment analysis of DAMs in different comparison groups. A-C: The abscissa represents the enrichment score, and the ordinate represents the pathway information for the top 20 pathways. The bubble size represents the number of DAMs, and the bubble color gradient represents the magnitude of the p value; the larger the bubble is, the greater the number of differentially abundant metabolites present in the pathway; the bubble color changes from blue to red. The smaller the enrichment p value is, the greater the significance. D-F: Comparison of the 10 pathways with the smallest P values for KEGG upregulation and downregulation. The abscissa represents the ratio of the number of foreground differentially abundant metabolites to the number of background metabolites (ListHits/TotalHits), and the ordinate represents the name of the KEGG pathway
In addition, the 10 pathways with the smallest P values in the KEGG analysis were selected, and comparisons between upregulated and downregulated genes were performed (Fig. 7D, E, and F). The upregulated DAMs in the AN0 vs. AN1 comparison were related primarily to galactose metabolism and fructose and mannose metabolism, whereas the downregulated DAMs were related to aminoacyl-tRNA biosynthesis and D-amino acid metabolism (Fig. 7D). In the AN2 vs. AN1 comparison, the most significantly upregulated term was D-amino acid metabolism, whereas the downregulated DAMs were related to taste transduction, starch and sucrose metabolism, purine metabolism, O-antigen nucleotide sugar biosynthesis, and amino sugar and nucleotide sugar metabolism (Fig. 7E). In the AN2 vs. AN0 comparison, the upregulated DAMs were related primarily to aminoacyl-tRNA biosynthesis and D-amino acid metabolism, and the downregulated DAMs were related to galactose metabolism and fructose and mannose metabolism (Fig. 7F).
Joint analysis of the transcriptome and metabolome
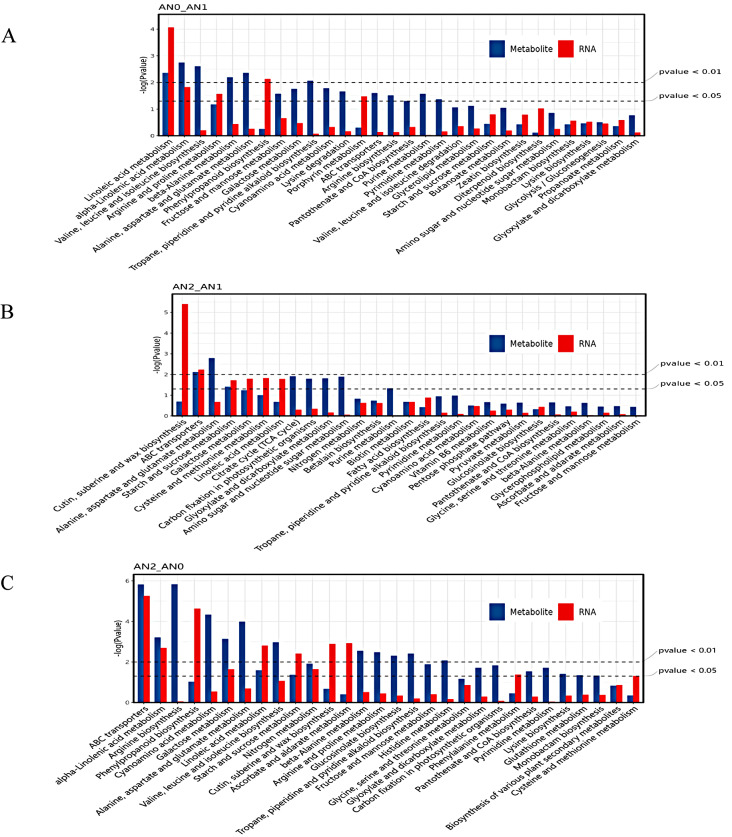
Figure 8 shows the top 30 enriched KEGG pathways, as depicted as a histogram. Interestingly, DEGs and DAMs were simultaneously significantly enriched in linoleic acid metabolism and alpha-linolenic acid metabolism, which were induced by nitrogen deficiency in AN0 vs. AN1 (Fig. 8A). In AN2 vs. AN1, DEGs and DAMs were significantly enriched in starch and sucrose metabolism and the ABC transporter pathway (Fig. 8B). In AN2 vs. AN0, DEGs and DAMs were significantly enriched in the ABC transporter, alpha-linolenic acid metabolism, galactose metabolism, linoleic acid metabolism, starch and sucrose metabolism and nitrogen metabolism pathways (Fig. 8C). The alpha-linolenic acid metabolism, starch and sucrose metabolism, nitrogen metabolism, and ABC transporter pathways were the key pathways involved in the response of potato tuber formation to nitrogen.
Fig. 8.
Top 30 KEGG pathways from the enrichment analysis of DEGs and DAMs according to transcriptomic and metabolomic data. A-C: KEGG Pathway Histogram the abscissa represents metabolic pathways, and the ordinate represents the P values of enriched DEGs (red) and DAMs (blue), as shown as the -log (p value) with thresholds of P < 0.01 and P < 0.05
Critical pathway analysis
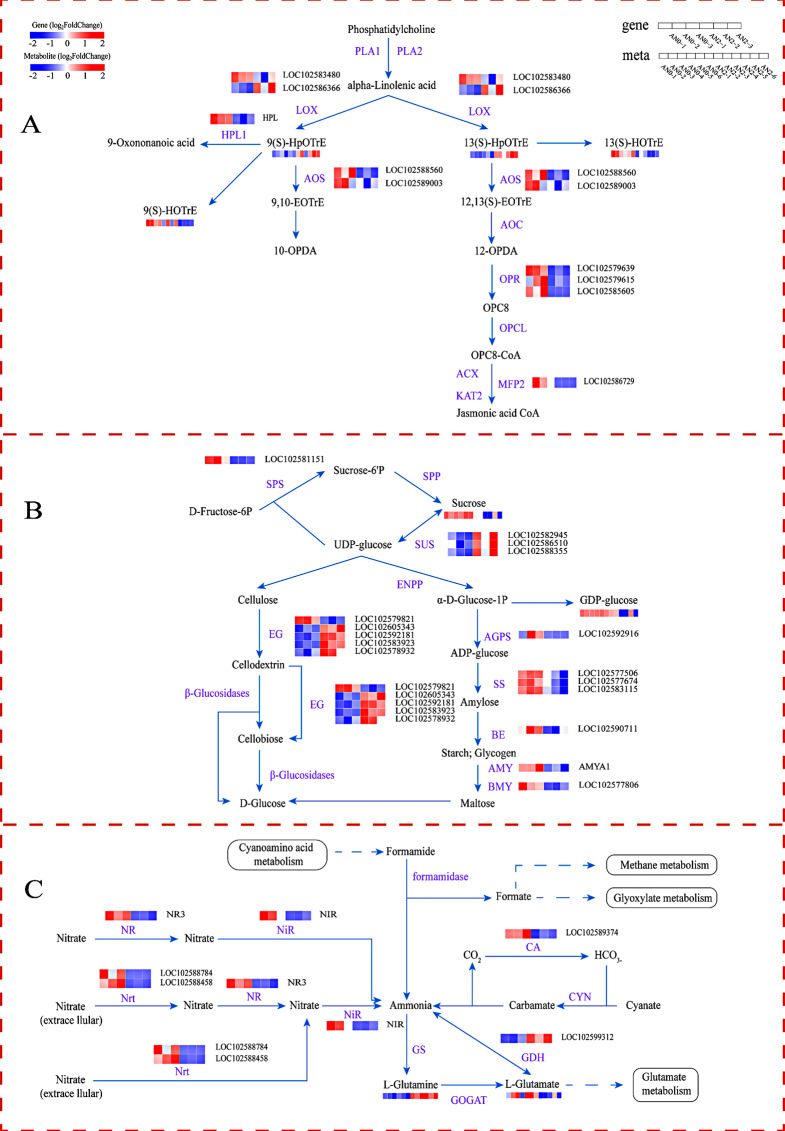
Nine genes with significant differences in the alpha-linolenic acid metabolism pathway were identified, namely, two LOX (lipoxygenase) genes, two AOS (allene oxide synthase) genes, one HPL1 (hydroperoxide lyase) gene, three OPR (12-oxophytodienoic acid reductase) genes, one MFP2 (multifunctional protein) gene, and three metabolites, namely, 9(S)-HpOTrE, 13(S)-HpOTrE and (13 S)-Hydroxyoctadeca-9,11,15-trienoate (13(S)-HOTrE) (Fig. 9A). One LOX gene and two metabolites (9(S)-HpOTrE and 13(S)-HpOTrE) were upregulated, whereas one LOX gene, two AOS genes, one HPL1 gene, three OPR genes, one MFP2 gene and one metabolite (13(S)-HOTrE) were downregulated in AN2 vs. AN0. The results demonstrated that LOX, AOS, HPL1, OPR, and MFP2 play crucial roles in the alpha-linolenic acid metabolism pathway and play pivotal roles in the regulation of nitrogen levels (Table S5).
Fig. 9.
Changes in DEGs and DAMs involved in the main metabolic pathways in potato stolons under different nitrogen concentrations. (A) Alpha-linolenic acid metabolism. PLA1: phospholipase A1; PLA2: phospholipase A2; LOX: lipoxygenase; HPL1: hydroperoxide lyase; AOS: allene oxide synthase; AOC: allene oxide cyclase; OPR: 12-oxophytodienoic acid reductase; OPCL: OPC-8:0 CoA ligase; ACX: acyl-CoA oxidase; KAT2: 3-ketoacyl-CoA thiolase 2; MFP2: multifunctional protein. (B) Starch and sucrose metabolism. SPS: sucrose‒phosphate synthase; SPP: sucrose‒phosphatase; SUS: sucrose synthase; ENPP: ectonucleotide pyrophosphatase; EG: endoglucanase; AGPS: glucose‒1‒phosphate adenylyltransferase; SS: starch synthase; BE: 1,4‒glucan branching enzyme; AMY: alpha‒amylase; BMY: beta‒amylase. (C) Nitrogen metabolism. NR: nitrate reductase; NiR: ferredoxin-nitrite reductase; Nrt: nitrite transporter; GS: glutamine synthetase; GOGAT: glutamate synthase; GDH: glutamate dehydrogenase; CA: carbonic anhydrase; and CYN: cyanate hydratase. Red represents relatively highly expressed genes and metabolites, blue represents relatively poorly expressed genes and metabolites, and genes that met the P < 0.05 and |log2-fold changes|>1 thresholds were defined as DEGs. Metabolites that met the P < 0.05 and VIP > 1 thresholds were defined as DAMs
Sixteen genes and 2 metabolites with significantly different abundances were enriched in the starch and sucrose metabolism pathways (Fig. 9B). Three SUS (sucrose synthase) and four EG (endoglucanase) genes were upregulated, whereas one SPS (sucrose-phosphate synthase), one AGPS (glucose-1-phosphate adenylyltransferase), three SS (starch synthase), one BE (1,4-alpha-glucan branching enzyme), one AMY (alpha-amylase), one BMY (beta-amylase), and one EG gene and two metabolites (sucrose and GDP-glucose) were downregulated in AN2 vs. AN0. SUS, SS, SPS, AGPS, AMY, BMY, BE and EG were identified as key genes in the starch and sucrose metabolism pathway (Table S6).
The 7 nitrogen metabolism-related genes whose abundance significantly differed were one NR (nitrate reductase), two Nrts (nitrite transporters), one NiR (ferredoxin-nitrite reductase), one CA (carbonic anhydrase), and one GDH (glutamate dehydrogenase) gene. Two metabolites (L-glutamine and L-glutamate) also showed significant differences in abundance (Fig. 9C). One GDH gene and one metabolite (L-glutamine) were upregulated, whereas one NR gene, two Nrt genes, one NiR gene, one CA gene and one metabolite (L-glutamate) were downregulated in AN2 vs. AN0 (Table S7).
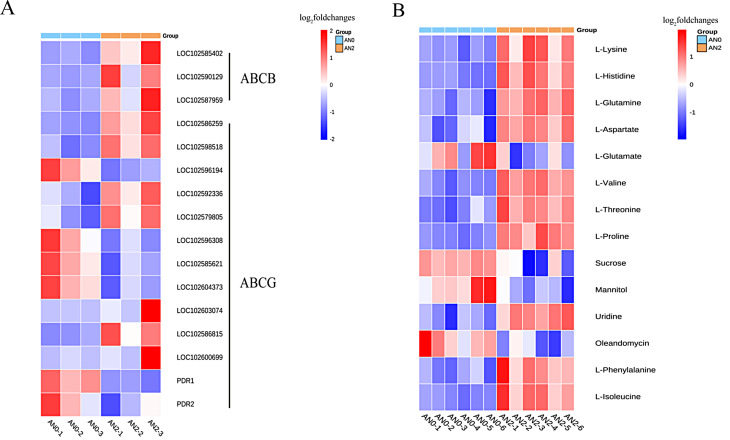
In the ABC transporter pathway, 16 ABC transporter family member genes and 14 DAMs were significantly enriched (Fig. 10, Table S8). Ten genes and 10 metabolites were significantly upregulated, and 6 genes and 4 metabolites were significantly downregulated in AN2 vs. AN0 (Fig. 10A, B).
Fig. 10.
Changes in DEGs and DAMs involved in the ABC transporter pathway in potato stolons under different nitrogen concentrations. (A) Heat maps of DEGs. ABCB: ATP-binding cassette, subfamily B; ABCG: ATP-binding cassette, subfamily G. A change in color from blue to red indicates the fold change in the genes, from low to high (P < 0.05). (B) Heat maps of DAMs. A change in color from blue to red indicates the fold change of the metabolite as it changes from low to high (P < 0.05 and |log2-fold changes|>1)
Association analysis of key differentially expressed genes
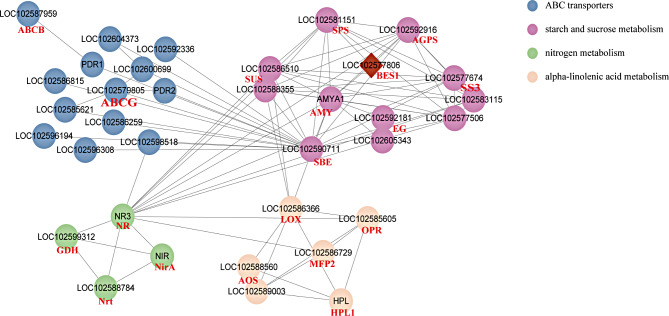
A network diagram was created depicting the interactions of the key pathways and genes to understand the detailed molecular mechanisms involved in the response of potato stolons to different concentrations of nitrogen (Fig. 11). The most relevant DEGs in the network diagram were screened out. Among them, one significantly downregulated AMY (AMY1) gene interacted with one alpha-linolenic acid metabolism gene (LOX), ten starch and sucrose metabolism genes (SPS, SUS, AGPS, SS, SBE, BMY, and EG), and one nitrogen metabolism gene (NR). A significantly downregulated SBE (LOC102590711) gene interacted with 8 starch and sucrose metabolism genes (SPS, SUS, AGPS, SS, and AMY) and 12 ABC transporter genes (ABCG). Three significantly downregulated SS3 genes (LOC102577506, LOC102577674, and LOC102583115) interacted with nine starch and sucrose metabolism genes (SPS, SUS, AGPS, SS, SBE, and AMY) and one nitrogen metabolism gene (NR). A significantly downregulated SPS (LOC102581151) gene interacted with eight starch and sucrose metabolism genes (SPS, SUS, AGPS, SS, and SBE) and one nitrogen metabolism gene (NR). Two significantly downregulated SUS (LOC102586510, LOC102588355) genes interacted with one alpha-linolenic acid metabolism gene (LOX), seven starch and sucrose metabolism-related genes with significant differential expression (SPS, AGPS, SS3, SBE, and AMY), and one nitrogen metabolism gene (NR). A significantly downregulated AGPS (LOC102592916) gene interacted with nine starch and sucrose metabolism genes (SPS, SUS, SS, SBE, AMY, and BMY) and one nitrogen metabolism gene (NR). One significantly downregulated NR (NR3) gene interacted with two alpha-linolenic acid metabolism genes (OPR, MPF2), eight starch and sucrose metabolism genes (SPS, SUS, AGPS, SS, and AMY), three nitrogen metabolism genes (Nrt, NirA, and GDH), and one ABC transporter gene (ABCG). In addition, the SPS and AGPS genes interact with one BES1 transcription factor. Network analysis revealed that the AMY (AMY1), SBE (LOC102590711), SS (LOC102577506, LOC102577674, LOC102583115), SPS (LOC102581151), SUS (LOC102586510, LOC102588355), AGPS (LOC102592916) and NR (NR3) genes could effectively influence genes related to α-linolenic acid, starch and sucrose metabolism; nitrogen metabolism; and ABC transporters.
Fig. 11.
Correlation network of significant DEGs associated with alpha-linolenic acid metabolism, starch and sucrose metabolism, nitrogen metabolism, and ABC transporters. The red diamonds represent transcription factors, the circles represent DEGs, and the lines represent interactions with correlations
Effects of different nitrogen treatments on potato yield and yield components
Table 2 shows that, compared with those in the AN1 treatment, the number of tubers per plant in the AN2 treatment significantly decreased, by 37.80%. Compared with those in the AN1 treatment, the tuber weight per plant in the AN0 and AN2 treatments significantly decreased, by 20.19% and 51.35%, respectively. Compared with those in the AN1 treatment, the commodity rates in the AN0 and AN2 treatments decreased by 71.16% and 31.05%, respectively. Compared with that of AN1, the tuber dry weights per plant of AN0 and AN2 decreased by 21.70% and 54.20%, respectively.
Table 2.
Changes in potato yield components
| Treatment | Tuber number per plant | Tuber weight per plant (g) | Commodity rate>50 g (%) | Tuber dry weight per plant (g) |
|---|---|---|---|---|
| AN0 | 11.67 ± 0.88a | 306.90 ± 0.20b | 20.97 ± 1.44c | 70.40 ± 0.20b |
| AN1 | 12.33 ± 0.33a | 384.53 ± 0.57a | 73.59 ± 3.06a | 89.90 ± 2.26a |
| AN2 | 7.67 ± 0.88b | 187.07 ± 4.17c | 50.74 ± 3.87b | 41.17 ± 7.67c |
Note All the data are expressed as the means ± SEs, n = 10. According to Duncan’s test, the different lowercase letters indicate significant differences between treatments (P < 0.05). Commercial potato rate = commercially acceptable tuber weight per plant (> 50 g tuber weight)/total tuber weight per plant × 100%
Discussion
As an indispensable mineral nutrient element, nitrogen is required by plants. It plays an irreplaceable role in plant life activities and is a key factor affecting plant production and quality [25, 26]. Physiological and biochemical index analyses have revealed that nitrogen has diverse regulatory effects on plant growth [27, 28]. Previous studies have shown that nitrogen deficiency can lead to a decrease in plant height, leaf chlorophyll content, root and bud dry matter weight and nitrogen accumulation [5], which is similar to the results of this study. In the present study, nitrogen deficiency resulted in a dwarfing of potato plants, decreased dry matter mass and nitrogen accumulation, and decreased leaf Chl a, Chl b, Car, and Chl a + b contents. However, excessive nitrogen increased plant height, dry matter weight and nitrogen accumulation, and the Chl a and Car contents also increased. The formation of potato tubers is a complex developmental process. After the initiation of tuber formation, the stolon stops growing, and the increase in the number and volume of pith, ring pith and cortex cells in the subapical region of the stolon leads to tuber formation, accompanied by starch synthesis and protein accumulation [4, 29]. In this study, through ultrastructural analysis of stolons, it was found that low nitrogen could lead to thickening of the stolon cell wall and plasma membrane and an increase in the cell gap, which indicated that nitrogen deficiency led to premature expansion of stolon cells and earlier formation of tubers. In contrast, excessive nitrogen increased the number of mitochondria, the cell wall and plasma membrane became thinner, and the intercellular space decreased, indicating that high nitrogen delayed the formation of tubers in stolon cells such that they were still in the young stage for a long period. In addition, the changes in potato yield traits verified that the nitrogen level could regulate the tuber formation process. In this study, high nitrogen significantly reduced the number of tubers per plant and the tuber weight per plant, and low nitrogen significantly reduced the commodity potato rate. Furthermore, high nitrogen leads to excessive development of the aboveground part of the potato plant, whereas low nitrogen leads to insufficient nutrients in the plant and the formation of excessively small potatoes.
Transcriptomic and metabolomic studies have shown that alpha-linolenic acid metabolism plays an important physiological role in plant resistance to stress [30, 31] and that the accumulation of many metabolites and genes is induced or inhibited under abiotic stress [32, 33]. This study revealed that many DEGs and DAMs were associated with alpha-linolenic acid metabolism, starch and sucrose metabolism, nitrogen metabolism, and the ABC transporter pathway, which are key pathways involved in the response of potato stolons to nitrogen stress (Figs. 9, 10 and 11). Moreover, this study identified 13(S)-HpOTrE as a key metabolite, as well as LOX, AOS, HPL1, OPR and MFP2 (Fig. 10A), which are related to jasmonic acid (JA) production, as key genes. These results indicate that nitrogen deficiency and excess nitrogen significantly affect alpha-linolenic acid metabolism, which may lead to the accumulation of key metabolites and gene expression, thereby promoting JA biosynthesis. JA biosynthesis can affect plant stress resistance [34]. Taken together with the observed yield, these findings suggest that JA biosynthesis can affect tuber formation.
The results of the transcriptomic and metabolomic analyses of potato stolons revealed that seven genes related to sucrose synthase and endoglucanase in the starch and sucrose metabolism pathway, which provides carbon sources for stolon growth, were upregulated under high nitrogen levels, namely LOC102582945, LOC102586510, LOC102588355, LOC102605343, LOC102592181, LOC102583923 and LOC102578932,. Previous studies have confirmed that SUS, SPS, and SPP can affect the synthesis and accumulation of sucrose [35–37]. Among them, SUS can reversibly synthesize sucrose, and SPS catalyzes the conversion of uridine diphosphate glucose and fructose-6-phosphoric acid to sucrose-6-phosphoric acid, which is then irreversibly converted to sucrose by SPP [38, 39]. Previous studies have shown that plants resist the damage caused by stress to roots by accumulating a large amount of sugar in the roots and that soluble sugars (such as glucose, sucrose and trehalose) reduce the membrane osmotic potential by binding to membrane lipid bilayers to reduce osmotic pressure changes and maintain the ability of cells to expand, increasing plant tolerance to abiotic stress [40]. In addition, sugars can act as small molecule signaling substances against abiotic stresses [41]. We also obtained similar results. We found that nitrogen deficiency upregulated the expression of genes related to SPS, AGPS, SS, BE, AMY and BMY in stolons and that the contents of sucrose and GDP-glucose also increased. These findings indicate that under nitrogen deficiency, the sugar content in the stolons of potato plants increases to promote tuberization. This phenomenon may be one of the reasons why nitrogen deficiency leads to early tuberization of stolons. However, the commodity rate of potatoes was significantly reduced, which may be due to the lack of nutrients during the expansion of potato tubers caused by nitrogen deficiency, resulting in the failure of tubers to expand fully. These results are consistent with those of previous studies, which have shown that stresses applied during the tuber initiation and tuberization stages not only restrain foliage and plant development but also limit tuber mass [42].
Carbon and nitrogen metabolism in plants is closely related, and there is a mechanism of mutual regulation. Carbon metabolism provides energy and organic matter to support plant growth and development, whereas nitrogen metabolism is involved in the synthesis and distribution of photosynthetic products [43]. Previous studies have demonstrated potential roles for these nitrogen metabolism-associated genes, especially transporter genes, in nitrogen stress tolerance in potatoes [44–46]. Nitrite transporters are responsible for absorbing nitrate from the soil and transporting it between completely different parts of the plant. They provide nitrates where they are needed to respond to adverse environmental conditions [47]. Moreover, according to previous reports, the NRT family is involved in root growth, flowering time, various physiological processes, and the transcriptional regulation of hormone and nitrate signals [48–50]. Studies have shown that the upregulated DEGs include members of the NIR and NRT gene families, which increase crop nutrient uptake [51]. We identified several Nrt family genes (Fig. 10C). The transcriptomic and metabolomic data revealed that the NR-, Nrt-, NiR-, and CA-related DEGs play important roles in methane metabolism, glyoxylate metabolism, and glutamate metabolism, which are associated with nitrogen metabolism. In addition, high nitrogen levels increase the activity of the GDH gene, which is involved in the catalysis of NH4+ and 2-oxogluconate to produce glutamic acid [52] and plays an important role in ammonium assimilation and stress resistance [53]. These results suggest that stolons respond to nitrogen stress by regulating nitrogen metabolic pathways. These DEGs and their functions are essential for potato nitrogen use efficiency and trait variation [54]. The ABC transporter-related AtABCB1 gene has been shown to be expressed primarily in primary and lateral roots, promoting root hair growth and regulating root development [55]. Studies have shown that plant ABCG transporters are involved in the transport of JA and are among the main transporters of plant hormones [56]. ABCG transporters are localized on the plasma membrane and nuclear membrane. By regulating the transport of JA to the extracellular space and JA-isoleucine to the nucleus, the distribution of JA and JA-isoleucine in the cytoplasm and nucleus is controlled, thereby affecting JA signal transduction [57]. In this study, ABC transporters constitute one of the key pathways regulating tuber formation. It is speculated that ABC transporters are associated with alpha-linolenic acid metabolism related to JA biosynthesis, which mediates JA transport between cells and regulates potato tuber formation. In this study, L-valine, L-lysine, L-aspartate, L-isoleucine, and L-histidine were identified as the key metabolites in the ABC transporter pathway. In addition, network analysis revealed that the AMY, SBE, SS, SPS, SUS, AGPS and NR genes play important roles in alpha-linolenic acid metabolism, starch and sucrose metabolism, nitrogen metabolism, and the ABC transporter pathway, which are associated with tuber formation. Finally, to verify the accuracy of the transcriptomic results, we performed qRT‒PCR verification. The candidate genes could be used for genetic manipulation to increase nitrogen utilization efficiency in potatoes via transgenic, CRISPR/Cas9 or base-editing technologies [58]. Further experimental verification is needed to substantiate the findings regarding the molecular functions of these genes.
Conclusion
In this study, the mechanism underlying the response of potato tuber formation to nitrogen concentration was explored via a combined multiomics analysis method. Under nitrogen deficiency, the physiological indexes and metabolites presented positive comprehensive responses. However, high nitrogen levels significantly increased the plant height, dry matter weight and nitrogen accumulation, and the Chl a and Car levels also increased. Transcriptomic analysis revealed that 2756 genes were differentially expressed under nitrogen stress. The metabolomics results revealed that 600 DAMs were involved in the response to nitrogen stress. Moreover, an integrated analysis of the transcriptome and metabolome revealed that nitrogen primarily influences pathways associated with alpha-linolenic acid metabolism, starch and sucrose metabolism, nitrogen metabolism, and ABC transporters. Nitrogen deficiency significantly promoted the accumulation of sucrose, GDP-glucose and L-glutamate by increasing the expression of genes related to AMY, SBE, SS, SPS, and AGPS and regulating the starch and sucrose metabolism and nitrogen metabolism pathways to promote the formation of stolon tubers. However, high nitrogen levels had the opposite effect. Furthermore, a high nitrogen supply increased the expression of EG-, SUS-, and GDH-related genes; increased the contents of 9(S)-HpOTrE, 13(S)-HpOTrE and L-glutamine; increased the nitrogen tolerance in the stolon; and ultimately decreased the tuber number per plant, the tuber weight per plant and the commodity rate. Our findings are expected to provide new insights into the molecular pathways of potato tuberization in response to different nitrogen supply levels and strengthen future research on tuber yield formation and increased nitrogen use efficiency in potatoes.
Electronic supplementary material
Below is the link to the electronic supplementary material.
Author contributions
KXD, YS, LCW and YZ designed the research. KXD, YS and GKT carried out the experiments. KXD and YS analyzed the data. KXD wrote this paper. LCW and YZ supervised and complemented the writing of the article. All the authors read and approved the final manuscript.
Funding
This work was supported by the National Potato Industry Technology System of China (CARS-09-ES37), the Heilongjiang Province Agricultural Science and Technology Innovation Leapfrog Engineering Agricultural Key Technology Science and Technology Innovation Key Projects (CX23GG02), and the Pilot Cultivation Project of the Keshan Branch of the Heilongjiang Academy of Agricultural Sciences (XDYBA2023-02).
Data availability
The raw sequence data have been submitted to the NCBI Gene Expression Omnibus (GEO) datasets with accession number GSE271112These metabolite data have been uploaded to Genome Sequence Archive (https://ngdc.cncb.ac.cn/omix/) with the identifier OMIX007711.
Declarations
Ethics approval and consent to participate
No specific permits were needed, and material collection and molecular experiments were performed in accordance with current Chinese regulations.
Consent for publication
Not applicable.
Competing interests
The authors declare no competing interests.
Footnotes
Publisher’s note
Springer Nature remains neutral with regard to jurisdictional claims in published maps and institutional affiliations.
Kaixin Ding and Ying Shan are co-first authors.
References
- 1.Jagesh Kumar T, Tanuja B, Sapna D, Shivangi V, Sarika S, Virupaksh UP, Rasna Z, Nilofer A, Vaishali M, Rajesh KS et al. Physiological and genome-wide RNA-sequencing analyses identify candidate genes in a nitrogen-use efficient potato cv. Kufri Gaurav. Plant Physiol Biochem 2020, 154(0). [DOI] [PubMed]
- 2.José Héctor G, Helen HT, Martin L, Bernie JZ, Martina VS. The nitrogen responsive transcriptome in potato (Solanum tuberosum L.) reveals significant gene regulatory motifs. Sci Rep 2016, 6(0). [DOI] [PMC free article] [PubMed]
- 3.Dourado C, CarlosBarba, Francisco JL, Jose MD, IvonneSaraiva JA. Innovative non-thermal technologies affecting potato tuber and fried potato quality. Trends Food Sci Technol. 2019;88:274–89.
- 4.Hannapel DJ, Sharma P, Lin T, Banerjee AK. The multiple signals that control tuber formation. Plant Physiol. 2017;174(2):845. [DOI] [PMC free article] [PubMed] [Google Scholar]
- 5.Heng G, Xiuqin P, Hao J, Yun Z, Guangji Y, Yongzhi Y, Tiancang N, Jian W. Transcriptome analysis reveals multiple effects of nitrogen accumulation and metabolism in the roots, shoots, and leaves of potato (Solanum tuberosum L). BMC Plant Biol 2022, 22(1). [DOI] [PMC free article] [PubMed]
- 6.Hashami SZ, Poyesh T. Effects of Different Rates of Nitrogen and Phosphorus Fertilizers on Growth and Yield of Potato (Solanum tuberosum) under Mechanized and Traditional Cultivation. International Journal of Plant & Soil Science 2021.
- 7.Som D, Anshul Sharma M, Pinky R, Brajesh S, Sundaresha S, Vinay B, Prashant GK, Virupakshagouda UP, Hemant Balasaheb K. Key players associated with tuberization in potato: potential candidates for genetic engineering. Crit Rev Biotechnol 2017, 37(7). [DOI] [PubMed]
- 8.Chang DC, Park CS, Kim SY, Kim SJ, Lee YB. Physiological growth responses by nutrient interruption in aeroponically grown Potatoes. Am J Potato Res. 2008;85(5):315–23. [Google Scholar]
- 9.Tiwari JK, Buckseth T, Devi S, Varshney S, Sahu S, Patil VU, Zinta R, Ali N, Moudgil V, Singh RK. Physiological and genome-wide RNA-sequencing analyses identify candidate genes in a nitrogen-use efficient potato cv Kufri Gaurav. Plant Physiol Biochemistry: PPB. 2020;154:171–83. [DOI] [PubMed] [Google Scholar]
- 10.Kloosterman B, Abelenda JA, Gomez MDMC, Oortwijn M, Bachem CWB. Naturally occurring allele diversity allows potato cultivation in northern latitudes. Nature 2013, 495(7440). [DOI] [PubMed]
- 11.Appeldoorn NJG, Sergeeva L, Vreugdenhil D, Plas LHWVD, Visser RGF. In situ analysis of enzymes involved in sucrose to hexose-phosphate conversion during stolon-to-tuber transition of potato. Physiol Plant. 2002;115(2):303–10. [DOI] [PubMed] [Google Scholar]
- 12.Hongli Z, Yingnan W, Jingyu Z, Xiaohua S, Zhong M, Mingshou F. Tuber formation as influenced by the C: N ratio in potato plants. J Plant Nutr Soil Sci. 2018;181(5):686–93.
- 13.Qiqige S, Jia L, Qin Y, Chen Y, Fan M. Effects of different nitrogen forms on potato growth and development. J Plant Nutr. 2017:00–00.
- 14.Yuan G, Liguo, Jia B. Hu, Ashok, Alva, Mingshou, Fan: Potato Stolon and Tuber Growth Influenced by Nitrogen Form. Plant Production Science; 2014.
- 15.Meng L, Zhang T, Chen Y, Zhang Y, Meng M. The influence of Endogenous Sugar on Potato Tuberization in in vivo conditions. Am J Potato Res 2020, 97(8).
- 16.Ding K, Shan Y, Wang L, Tian G, Li F, Wang H, Pang Z, Pan Y, Jiang H. Physiological response of potato leaves to uniconazole under drought stress during the tuber expansion period. Hortic Environ Biotechnol. 2024;65(5):847–66.
- 17.Jones JB. Jr: Kjeldahl method for nitrogen determination. 1991.
- 18.Chen S, Zhou Y, Chen Y, Gu J. Fastp: an ultra-fast all-in-one FASTQ preprocessor. Bioinformatics. 2018;34(17):i884–90. [DOI] [PMC free article] [PubMed] [Google Scholar]
- 19.Kim D, Langmead B, Salzberg SL. HISAT: A fast spliced aligner with low memory requirements. Nat Methods 2015, 12(4). [DOI] [PMC free article] [PubMed]
- 20.Roberts A, Trapnell C, Donaghey J, Rinn JL, Pachter L. Improving RNA-Seq expression estimates by correcting for fragment bias. Genome Biol. 2011;12(3):1–14. [DOI] [PMC free article] [PubMed] [Google Scholar]
- 21.Simon A, Theodor PP, Wolfgang H. HTSeq—a Python framework to work with high-throughput sequencing data. Bioinformatics. 2015(2):166–9. [DOI] [PMC free article] [PubMed]
- 22.Tarazona S, Garcia-Alcalde F, Dopazo J, Ferrer A, Conesa A. Differential expression in RNA-seq: A matter of depth. Genome Res. 2011;21(12):2213–23. [DOI] [PMC free article] [PubMed] [Google Scholar]
- 23.Yunyi Z, Lixiang Y, Xueyan H, Ying L, Chunli W, Qinfen H, Liying Y, Chunliu P. Transcriptomics and metabolomics association analysis revealed the responses of Gynostemma pentaphyllum to cadmium. Front Plant Sci 2023, 14(0). [DOI] [PMC free article] [PubMed]
- 24.Livak KJ, Schmittgen TD. Analysis of relative gene expression data using real-time quantitative PCR and the 2(-Delta Delta C(T)) Method. 2013. [DOI] [PubMed]
- 25.Quan X, Zeng J, Han, Zhigang, Zhang G. Ionomic and physiological responses to low nitrogen stress in tibetan wild and cultivated barley. Plant Physiology & Biochemistry; 2017. [DOI] [PubMed]
- 26.Wang YY, Hsu PK, Tsay YF. Uptake, allocation and signaling of nitrate. Trends Plant Sci. 2012(8):17. [DOI] [PubMed]
- 27.Good AG, Shrawat AK, Muench DG. Can less yield more? Is reducing nutrient input into the environment compatible with maintaining crop production? Trends Plant Sci. 2004;9(12):597–605. [DOI] [PubMed] [Google Scholar]
- 28.Zhu Y, Qi B, Hao Y, Liu H, Song S. Appropriate NH4+/NO3– ratio triggers Plant Growth and Nutrient Uptake of Flowering Chinese Cabbage by optimizing the pH value of nutrient solution. Front Plant Sci. 2021;12:656144. [DOI] [PMC free article] [PubMed] [Google Scholar]
- 29.Kolomiets MV, Hannapel DJ, Chen H, Gladon TRJ. Lipoxygenase is involved in the control of Potato Tuber Development. Plant Cell. 2001;13(3):613–26. [DOI] [PMC free article] [PubMed] [Google Scholar]
- 30.Farmer EE, Alméras E, Krishnamurthy V. Jasmonates and related oxylipins in plant responses to pathogenesis and herbivory. Current Opinion in Plant Biology 2003. [DOI] [PubMed]
- 31.Weber H. Fatty acid-derived signals in plants. Trends Plant Sci. 2002;7(5):217–24. [DOI] [PubMed] [Google Scholar]
- 32.Ling L, Xuyu Y, Juan L, Xiang W, Xiukang W. Metabolome and transcriptome association analysis revealed key factors involved in melatonin mediated cadmium-stress tolerance in cotton. Front Plant Sci 2022, 13(0). [DOI] [PMC free article] [PubMed]
- 33.Zhu H, Ai H, Cao L, Sui R, Ye H, Du D, Sun J, Yao J, Chen K, Chen L. Transcriptome analysis providing novel insights for Cd-resistant tall fescue responses to cd stress. Ecotoxicol Environ Saf. 2018;160(SEP):349–56. [DOI] [PubMed] [Google Scholar]
- 34.Li Y, Zhang S, Bao Q, Chu Y, Sun H, Huang Y. Jasmonic acid alleviates cadmium toxicity through regulating the antioxidant response and enhancing the chelation of cadmium in rice (Oryza sativa L). Environ Pollut. 2022;304:119178. [DOI] [PubMed] [Google Scholar]
- 35.Bilska-Kos A, Mytych J, Suski S, Magoń J, Zebrowski J. Sucrose phosphate synthase (SPS), sucrose synthase (SUS) and their products in the leaves of Miscanthus × giganteus and Zea mays at low temperature. Planta. 2020;252(2):23. [DOI] [PMC free article] [PubMed] [Google Scholar]
- 36.Liao G, Li Y, Wang H, Liu Q, Zhong M, Jia D, Huang C, Xu X. Genome-wide identification and expression profiling analysis of sucrose synthase (SUS) and sucrose phosphate synthase (SPS) genes family in Actinidia chinensis and A. Eriantha. BMC Plant Biol. 2022;22(1):1–15. [DOI] [PMC free article] [PubMed] [Google Scholar]
- 37.Liu C, Zhou G, Qin H, Guan Y, Wang T, Ni W, Xie H, Xing Y, Tian G, Lyu M. Metabolomics combined with physiology and transcriptomics reveal key metabolic pathway responses in apple plants exposure to different selenium concentrations. J Hazard Mater. 2024(Feb.15):464. [DOI] [PubMed]
- 38.Anna B-K, Jennifer M, Szymon S, Justyna M, Piotr O, Jacek Z. Sucrose phosphate synthase (SPS), sucrose synthase (SUS) and their products in the leaves of Miscanthus × giganteus and Zea mays at low temperature. Planta 2020, 252(2). [DOI] [PMC free article] [PubMed]
- 39.Guanglian L, Yiqi L, Hailing W, Qing L, Min Z, Dongfeng J, Chunhui H, Xiaobiao X. Genome-wide identification and expression profiling analysis of sucrose synthase (SUS) and sucrose phosphate synthase (SPS) genes family in Actinidia chinensis and A. Eriantha. BMC Plant Biol. 2022, 22(1). [DOI] [PMC free article] [PubMed]
- 40.Anzano A, Bonanomi G, Mazzoleni S, Lanzotti V. Plant metabolomics in biotic and abiotic stress: a critical overview. Phytochemistry reviews: proceedings of the Phytochemical Society of Europe 2022(2):21.
- 41.Husna S. Fareen, Sami, Shamsul, Hayat: glucose: Sweet or bitter effects in plants-a review on current and future perspective. Carbohydr Res. 2019;487:107884–107884. [DOI] [PubMed] [Google Scholar]
- 42.Dominika M, Krystyna Z, Beata W-N. Potato (Solanum tuberosum L.) Plant Shoot and Root Changes under Abiotic Stresses-Yield Response. Plants (Basel) 2022, 11(24). [DOI] [PMC free article] [PubMed]
- 43.Yongkang D, Haiyan Y, Hao Y, Yaqiong W, Sufan F, Wenlong W, Lianfei L, Weilin L. Integrative physiological, metabolomic and transcriptomic analysis reveals nitrogen preference and carbon and nitrogen metabolism in blackberry plants. J Plant Physiol. 2022, 280(0). [DOI] [PubMed]
- 44.Tiwari JK, Buckseth T, Zinta R, Saraswati A, Chakrabarti SK. Transcriptome analysis of potato shoots, roots and stolons under nitrogen stress. Sci Rep. 2020, 10(1). [DOI] [PMC free article] [PubMed]
- 45.Wang WH, Kohler B, Cao FQ, Liu GW, Gong YY, Sheng S, Song QC, Cheng XY, Garnett T, Okamoto M. Rice DUR3 mediates high-affinity urea transport and plays an effective role in improvement of urea acquisition and utilization when expressed in Arabidopsis. New Phytol. 2012(2):193. [DOI] [PubMed]
- 46.Zunaira A, Howton T, Yali S, Mukhtar M. The roles of aquaporins in plant stress responses. J Dev Biology. 2016;4(1):9. [DOI] [PMC free article] [PubMed] [Google Scholar]
- 47.Zhang GB, Meng S, Gong JM. molecular sciences the expected and unexpected roles of nitrate transporters in plant abiotic stress resistance and their regulation. 2019. [DOI] [PMC free article] [PubMed]
- 48.Cuesta C. Bouguyon, Eleonore, Martiniere, Alexandre, Bach, Lien, Rochette, Juliette: nitrate controls root development through posttranscriptional regulation of the NRT1.1/NPF6.3 transporter/Sensor. Plant Physiol. 2016;172(2):1237–48. [DOI] [PMC free article] [PubMed]
- 49.Teng Y, Liang Y, Wang M, Mai H, Ke L. Nitrate Transporter 11 is involved in regulating flowering time via transcriptional regulation of FLOWERING LOCUS C in Arabidopsis thaliana. Plant Science: Int J Experimental Plant Biology. 2019;284:30–6. [DOI] [PubMed] [Google Scholar]
- 50.Zhang Y, Cui, Meng, Bodan, Wei. Gong, Frantiek, Baluka, George: phosphorylation-mediated dynamics of Nitrate Transceptor NRT1.1 regulate Auxin Flux and Nitrate Signaling in lateral Root Growth. Plant Physiol. 2019;181(2):480–98. [DOI] [PMC free article] [PubMed] [Google Scholar]
- 51.Fang XZ, Tian WH, Liu XX, Lin XY, Jin CW, Zheng SJ. Alleviation of proton toxicity by nitrate uptake specifically depends on nitrate transporter 1.1 in Arabidopsis. New Phytol. 2016;211(1):149–58. [DOI] [PubMed]
- 52.Anathi M, Rafael Jorge Leon M, Aleysia K, Mauritz V, Emma S, Alex V. Glutamate dehydrogenase is essential in the acclimation of Virgilia divaricata, a legume indigenous to the nutrient-poor Mediterranean-type ecosystems of the Cape Fynbos. J Plant Physiol. 2019, 243(0). [DOI] [PubMed]
- 53.Ben Azaiez FE, Ayadi S, Capasso G, Landi S, Paradisone V, Jallouli S, Hammami Z, Chamekh Z, Zouari I, Trifa Y. Salt stress induces differentiated Nitrogen Uptake and antioxidant responses in two contrasting Barley Landraces from MENA Region. Agronomy. 2020, 10(1426).
- 54.Tiwari JK, Devi S, Ali N, Buckseth T, Kumar M. Genomics Approaches for Improving Nitrogen Use Efficiency in Potato. 2017.
- 55.Wu G, Carville JS, Spalding EP. ABCB19-mediated polar auxin transport modulates Arabidopsis hypocotyl elongation and the endoreplication variant of the cell cycle. Plant J. 2016;85(2):209–18. [DOI] [PMC free article] [PubMed] [Google Scholar]
- 56.Lorenzo B, Joohyun K, Donghwi K, Youngsook L, Enrico M. The role of ABCG-type ABC transporters in phytohormone transport. Biochem Soc Trans. 2015, 43(5). [DOI] [PMC free article] [PubMed]
- 57.Li Q, Zheng J, Li S, Huang G, Skilling S, Wang L, Li L, Li M, Yuan L, Liu P. Transporter-mediated nuclear entry of Jasmonoyl-Isoleucine is essential for Jasmonate Signaling. Mol Plant. 2017;10(5):695–708. [DOI] [PubMed] [Google Scholar]
- 58.Tiwari JK, Buckseth T, Singh RK, Kumar M, Kant S. Prospects of improving Nitrogen Use Efficiency in Potato: lessons from transgenics to genome editing strategies in plants. Front Plant Sci. 2020;11(0):597481. [DOI] [PMC free article] [PubMed]
Associated Data
This section collects any data citations, data availability statements, or supplementary materials included in this article.
Supplementary Materials
Data Availability Statement
The raw sequence data have been submitted to the NCBI Gene Expression Omnibus (GEO) datasets with accession number GSE271112These metabolite data have been uploaded to Genome Sequence Archive (https://ngdc.cncb.ac.cn/omix/) with the identifier OMIX007711.


