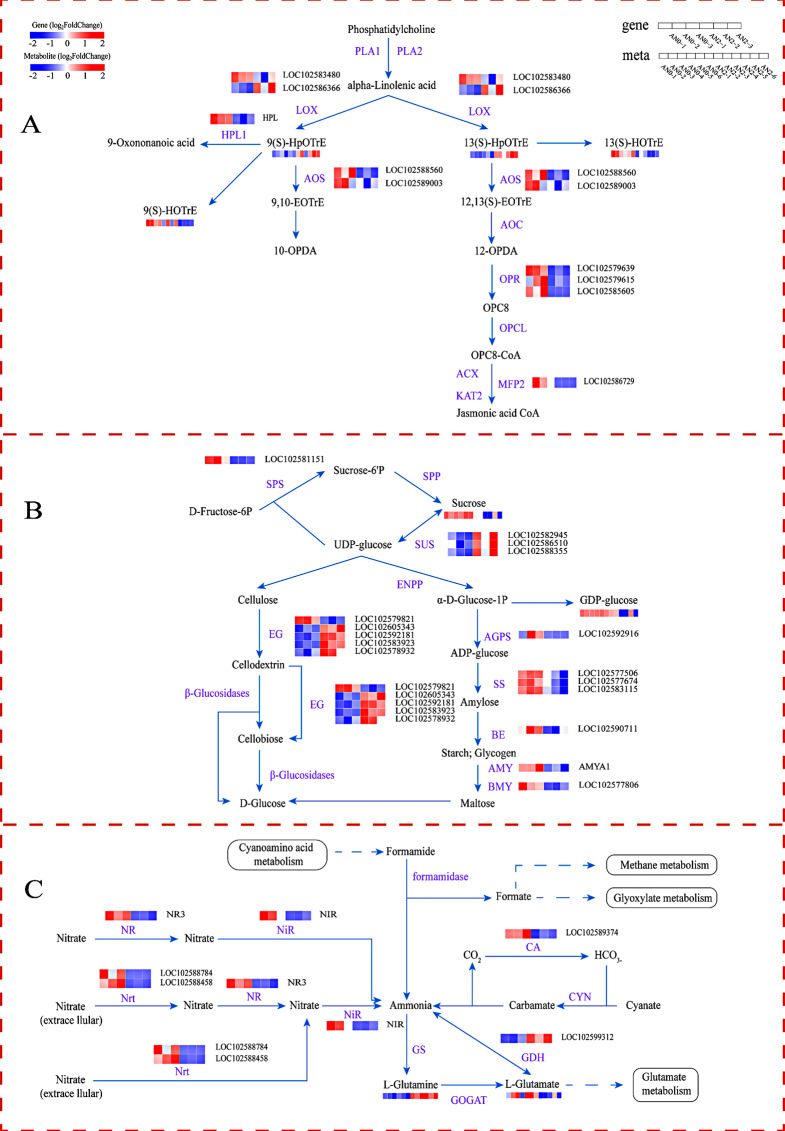
Fig. 9.
Changes in DEGs and DAMs involved in the main metabolic pathways in potato stolons under different nitrogen concentrations. (A) Alpha-linolenic acid metabolism. PLA1: phospholipase A1; PLA2: phospholipase A2; LOX: lipoxygenase; HPL1: hydroperoxide lyase; AOS: allene oxide synthase; AOC: allene oxide cyclase; OPR: 12-oxophytodienoic acid reductase; OPCL: OPC-8:0 CoA ligase; ACX: acyl-CoA oxidase; KAT2: 3-ketoacyl-CoA thiolase 2; MFP2: multifunctional protein. (B) Starch and sucrose metabolism. SPS: sucrose‒phosphate synthase; SPP: sucrose‒phosphatase; SUS: sucrose synthase; ENPP: ectonucleotide pyrophosphatase; EG: endoglucanase; AGPS: glucose‒1‒phosphate adenylyltransferase; SS: starch synthase; BE: 1,4‒glucan branching enzyme; AMY: alpha‒amylase; BMY: beta‒amylase. (C) Nitrogen metabolism. NR: nitrate reductase; NiR: ferredoxin-nitrite reductase; Nrt: nitrite transporter; GS: glutamine synthetase; GOGAT: glutamate synthase; GDH: glutamate dehydrogenase; CA: carbonic anhydrase; and CYN: cyanate hydratase. Red represents relatively highly expressed genes and metabolites, blue represents relatively poorly expressed genes and metabolites, and genes that met the P < 0.05 and |log2-fold changes|>1 thresholds were defined as DEGs. Metabolites that met the P < 0.05 and VIP > 1 thresholds were defined as DAMs

