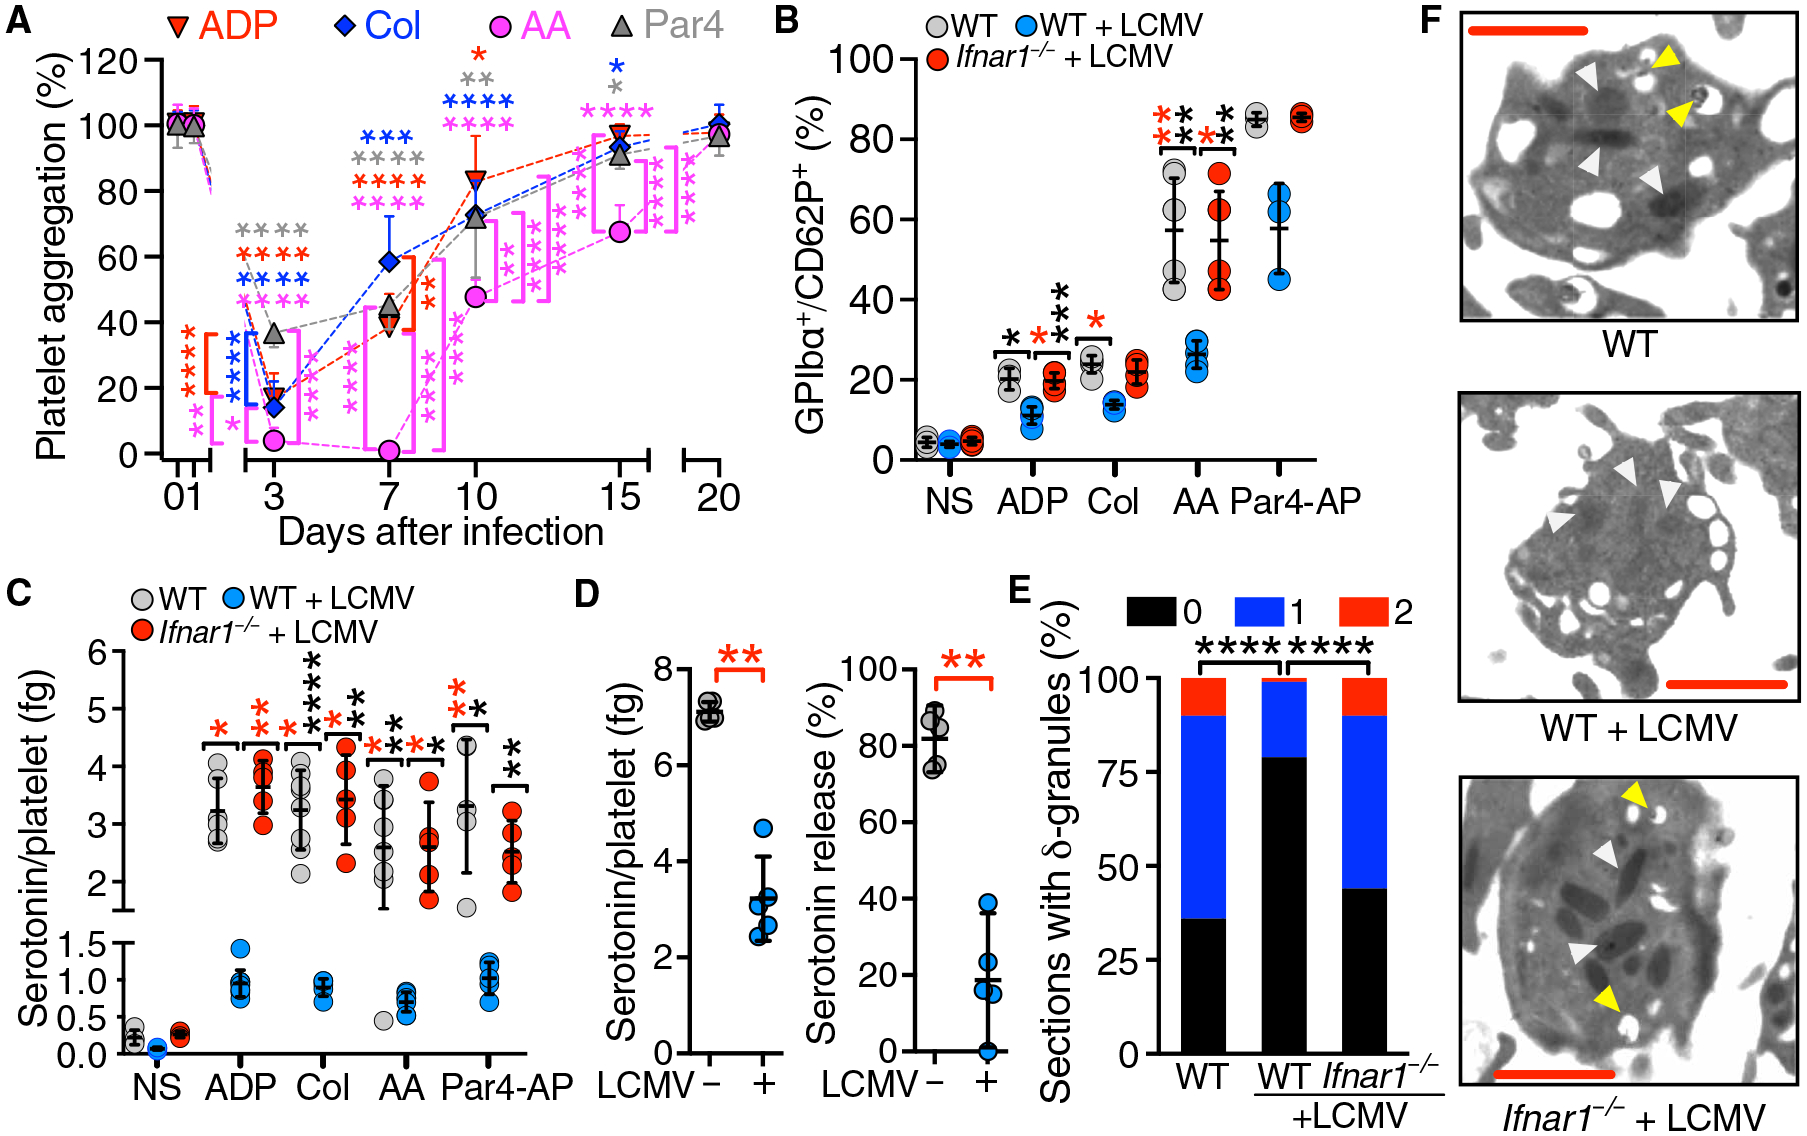
Fig. 3. Platelet function in LCMV-infected mice.

(A) Platelet aggregation (means ± SD; n = 10 mice per group) measured in PRP from LCMV-infected WT mice at the indicated times after infection (day 0). Stimulation by 5 μM ADP, collagen (Col; 4 μg/ml), 75 μM AA, or 40 μM Par4-AP. (B) Blood (n = 3 to 7 mice per group) from infected WT and Ifnar1−/− mice and noninfected WT controls was analyzed by flow cytometry at day 7 after infection for the percentage of GPIbα+/CD62P+ platelets after stimulation as in (A). NS, nonstimulated WT platelets. (C) PRP (n = 4 to 10 mice per group) in the blood described in (B) was analyzed at day 7 after infection for serotonin release. (D) Platelet serotonin content (left) and release after stimulation by ADP and Col (% of total; right) either in mice (n = 5 mice per group) 7 days after infection (+) or in noninfected mice (−). Data in (B) to (D) are shown as scatterplots with means ± SD. (E) Platelets with 0, 1, or 2 δ-granules (% of analyzed) visualized by transmission electron microscopy (TEM) in 41 to 85 platelet sections from mice in (C). (F) TEM visualization of α- and δ-granules indicated by white and yellow arrowheads, respectively. Scale bars, 500 nm. Statistical analysis: (A) Repeated-measures two-way ANOVA with the Geisser-Greenhouse correction for no assumption of sphericity followed by Dunnett’s test for comparisons at different times after infection compared to before infection for each agonist (asterisks at the top of symbols are color coded by agonist) or Tukey’s test for comparisons between agonists at each time after infection (asterisks at the side of symbols are color coded for the agonist with the lower value); (D) two-tailed Mann-Whitney test; (E) contingency table analysis by χ2 test. ****P < 0.0001; ***P < 0.001; **P < 0.01; *P < 0.05.
