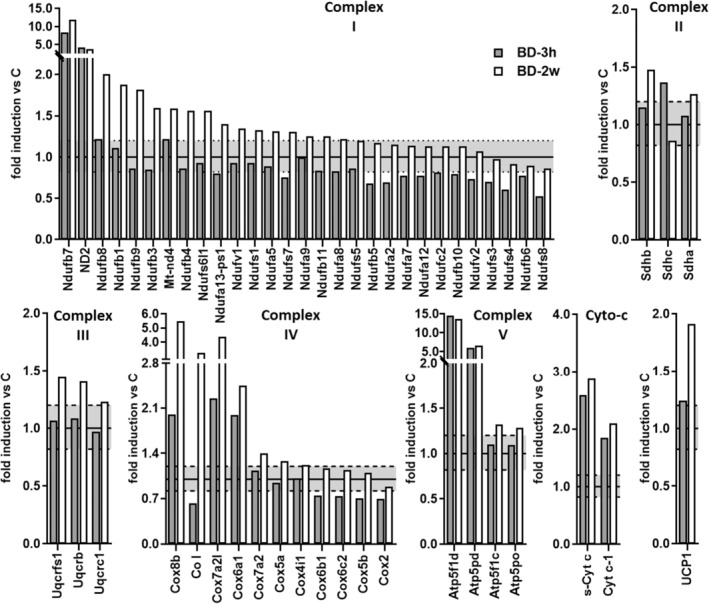
FIGURE 3.

Effect of BD on mitochondrial respiratory chain complexes subunits and UCP1 protein levels. Relative abundance of iBAT mitochondrial proteins determined by the label‐free proteomics approach. Data are summarized for proteins that can be assigned to respiratory chain complexes. Gene names for subunits that have changed have been reported. The values with a fold >1.2 are an expression of upregulation, whereas those with a fold <0.82 are indicative of a downregulation. The upper dotted line represents the value 1.2, and the lower dotted line represents the value 0.82. Each value is a result of two technical replicates obtained by a pool of 5 rats.
