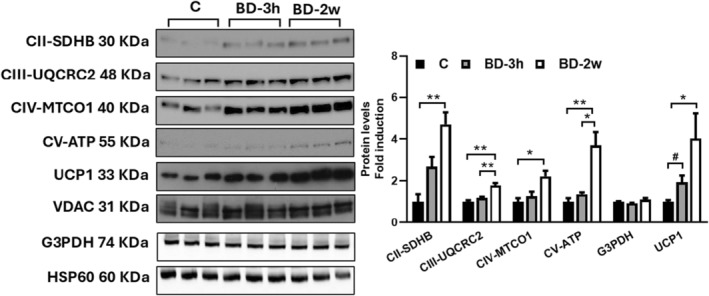
FIGURE 4.

Representative Western blots of respiratory complexes subunits (CII‐SDHB, CIII‐UQCRC2, CIV‐MTCO1, and CV‐ATP VA), mG3PDH, and UCP1 detected in isolated mitochondria from iBAT of C, BD‐2w, and BD‐3h rats (15 μg of protein/mouse/lane). VDAC or HSP60 was used as the loading control. Histograms represent the quantification of data. Data were normalized to the value obtained for C animals, set as 1. Values represent the mean ± SEM of 3 or 6 different rats. *p < .05, **p < .01; #ns by ANOVA, p = .018 by t‐test.
