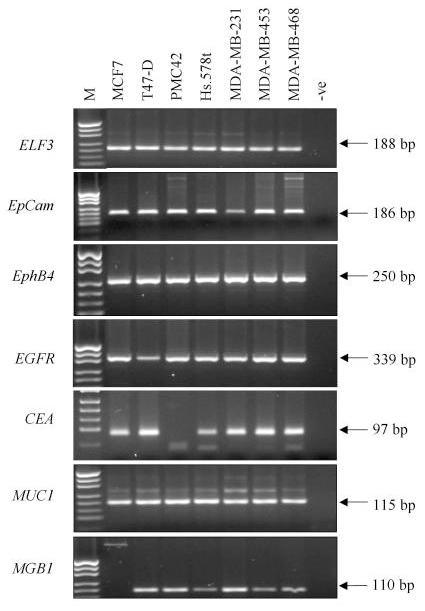
Figure 1.

Expression of seven RT-PCR markers in a panel of seven breast cancer cell lines. Each marker is shown in a separate panel and the size of the amplified product is indicated in base pairs (bp) M indicates the pUC19/HpaII marker, -ve indicates the RT-PCR negative control. Weak genomic or primer dimer bands are seen for some RT-PCRs.
