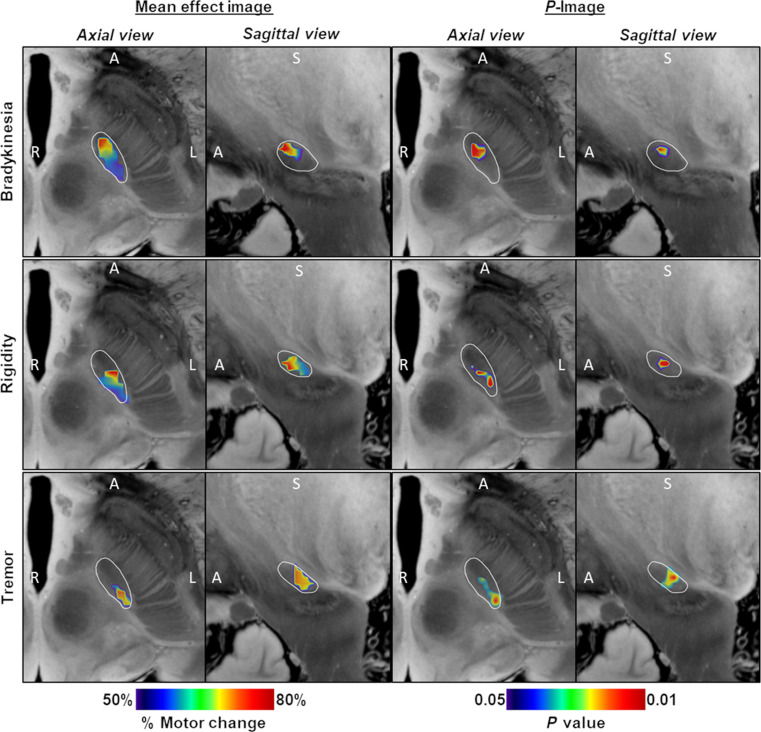
Fig. 1. Probabilistic FUS-STN lesion location maps associated with improvement in cardinal motor features.
(Left) Axial and sagittal slices of the mean effect image for each motor feature, color coded by the degree of improvement. (Right) Corresponding P-images. Color coding depicts the results of Brunner-Munzel test on a voxel-by-voxel basis. Only voxels that survived a P < 0.05 permutation threshold are included. The STN, outlined in white, is superimposed on slices of a 100-μm, 7-T brain scan in the MNI152 space (76). The image orientation is indicated for each slice: A, anterior; S, superior; and R/L, right/left.

