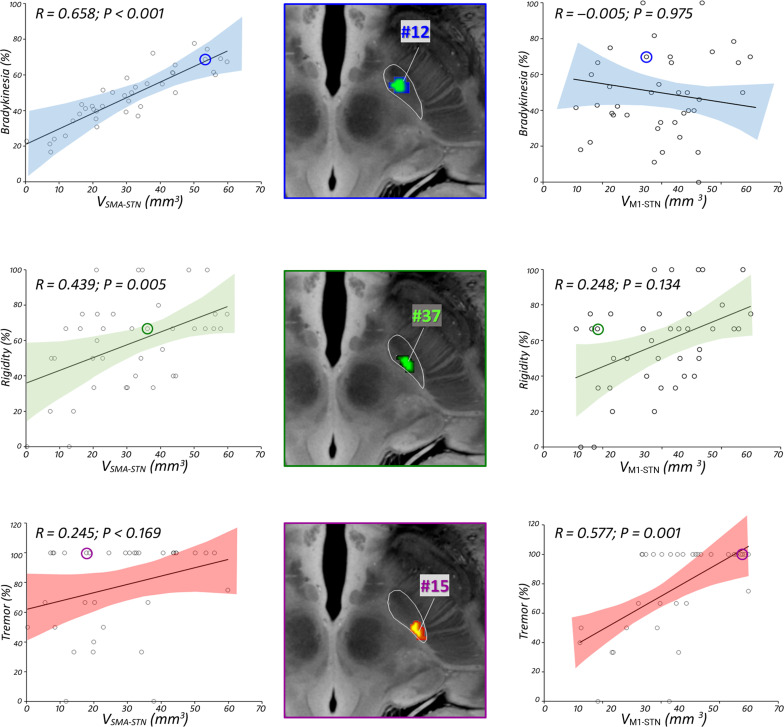
Fig. 3. Relationship between clinical outcome and lesion overlap with STN subregions.
Scatterplot and 95% confidence interval (shaded area) between motor improvement and volume of the SMA-STN (left) and M1-STN (right) covered by the respective lesion. Standardized regression coefficients R reflect the effect of the impact on motor subregions contributing to prediction of efficacy for each motor feature (blue for bradykinesia, green for rigidity, and red for tremor). (Middle) Lesion reconstruction of illustrative example subjects, overlaid with an ultrahigh-resolution (100-μm) template of the human brain (76). Selected examples include three different patients who exhibited sign-selective response per clinical feature: bradykinesia (blue), rigidity (green), tremor (red-yellow). See table S2 for clinical details for every subject. Adjusted clinical outcomes were regressed against the other predictor variable and controlled per total lesion volume.

