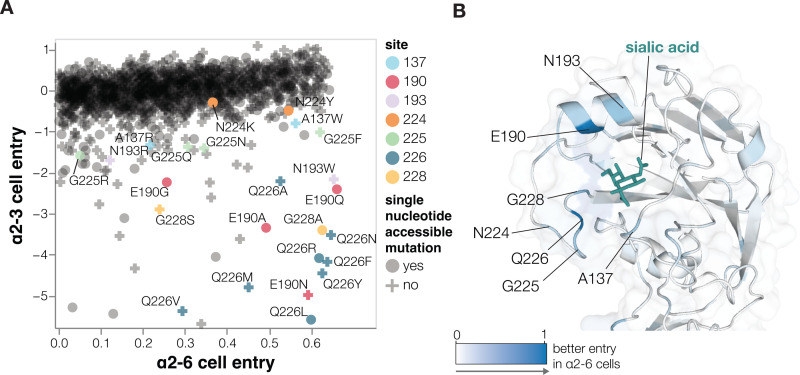
Fig 3. Effects of mutations on entry into cells expressing α2-6- versus α2-6-linked sialic acids.
(A) Effects of mutations on pseudovirus entry into 293 cells expressing α2-6- or α2-3-linked sialic acids. Each point is a different amino-acid mutation, with shapes indicating whether the mutation is accessible by a single-nucleotide change to the natural HA gene sequence. Sites where more than one mutation has large differences between α2–3 and α2–6 cell entry are labeled. Note that only mutations with a net favorable effect on entry into α2–6 cells are shown. Note that these experiments were performed in cell-culture media that contained 10% fetal bovine serum, which may also impact the effects of some mutations due to decoy receptors present in the serum. (B) Structure of the HA near the sialic-acid binding pocket (PDBs: 4KWM, 1JSO) with sites colored according to the average increase in α2–6 usage caused by mutations at that site. See https://dms-vep.org/Flu_H5_American-Wigeon_South-Carolina_2021-H5N1_DMS/a26_usage.html for interactive plots including a version of A that includes all mutations (not just those with net positive α2–6 cell entry) and an interactive heatmap of the change in α2–6 versus α2–3 usage for all mutations. The data underlying this figure can be found in S2 Data.

