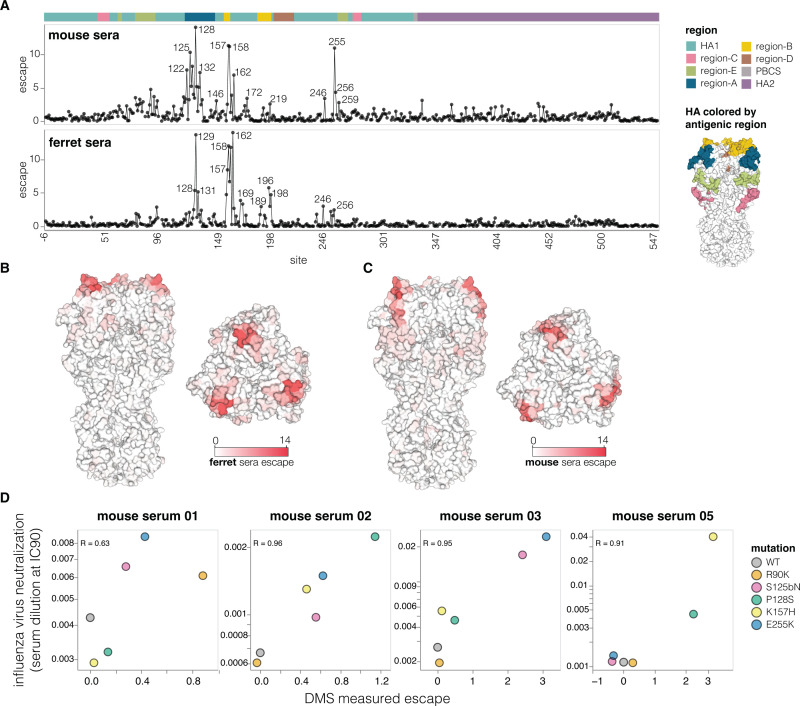
Fig 5. Effects of mutations on escape from serum neutralization.
(A) Total escape caused by all tolerated mutations at each HA site as measured in the deep mutational scanning, averaged across the sera of all animals from each species. The HA structure on the right shows the classically defined H3 antigenic regions [60]. See S6B Fig for details on the number of animals and immunization methods. See https://dms-vep.org/Flu_H5_American-Wigeon_South-Carolina_2021-H5N1_DMS/escape.html for interactive plots showing escape for each animal. The data underlying this panel can be found in S5 Data. (B) Average ferret sera escape overlaid on a surface representation of HA (PBD: 4KWM). (C) Same as in (B) but for mouse sera. (D) Correlation between escape for different HA mutants measured with deep mutational scanning (DMS) versus the change in neutralization measured using conventional neutralization assays with conditionally replicative influenza virus. The data underlying this panel can be found in S6 Data.

