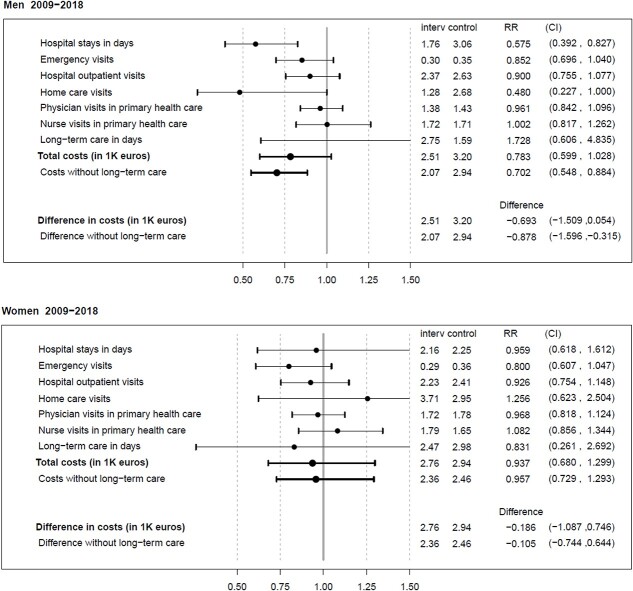
Figure 1.
Average annual health care service use in days, number of visits, or thousand euros (interv/control) and rate ratios (RRs) with 95% CI for the intervention group vs. control in health care service use and costs among men and women during the 8-year follow-up (2009–2018). In addition, for costs, differences in thousand euros are given.

