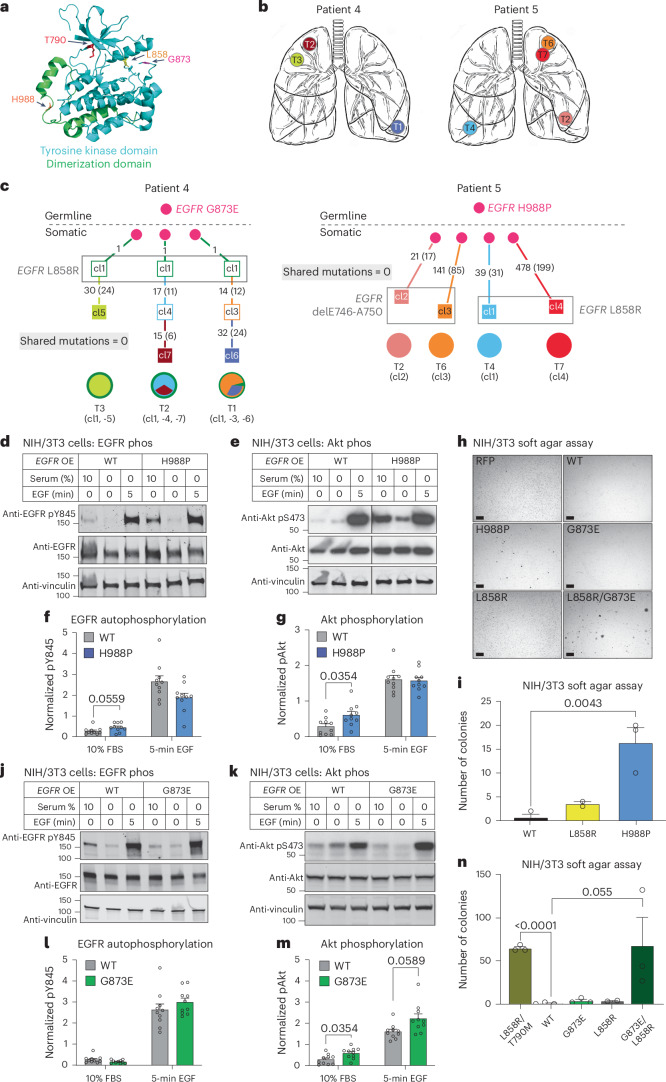
Fig. 4. Germline H988P and G873E mutations increase EGFR activity.
a, Position of the relevant residues within a partial EGFR protein crystal structure (aligned PDB structures EGFR 696-1022 T790M (5gty) and EGFR 703-985 (4zjv)). The dimerization domain is green and the catalytic tyrosine kinase domain blue. b, Schematic of tumor locations in patients 4 and 5. c, Lineage tracing of patient 4 and 5 tumors, derived from WES. Numbers on branches are mutations that accumulated between two nodes, which represent distinct clones identified by WES. Numbers in parentheses are exonic mutations that are not in the FFPE context. d–g,j–m, Functional effect of the H988P-EGFR mutant (d–g) or G873E mutant (j–m), compared with the WT construct. d,e,j and k are western blots and f,g,l and m are quantifications of the blots immediately above. The pY845 was normalized to vinculin, then total EGFR and finally to the average signal within an experiment for comparison across experiments. phos, phosphorylation. OE, overexpression. EGFR and pY845 are both rabbit antibodies and were run on different blots (processed in parallel), each with their own vinculin loading control, which was used for quantification. A representative vinculin blot is shown in the figure. The pS473 was normalized to a vinculin sample processing control from a matched EGFR blot, then to the average signal within an experiment. AKT and pS473 are both rabbit antibodies and were run on different blots (processed in parallel). Images vertically sliced to juxtapose nonadjacent lanes were run on the same gel (n = 10 biologically independent samples per figure). Data are presented as mean values ± s.e.m. A two-way ANOVA was performed to determine statistical significance and false recovery rate (FDR) q-values were corrected for multiple comparisons using the Benjamini, Krieger and Yekutieli procedure. h,i,n, Representative images of colony formation by NIH/3T3 cells in soft agar in cells expressing WT or mutant EGFR constructs (h). Scale bars, 100 μm. This experiment was repeated 3× with similar results, as quantified in i and n. Quantification data of colonies at least 20 μm in size is presented as mean values ± s.e.m. P values are a one-tailed, unpaired Student’s t-test not corrected for multiple comparisons.

