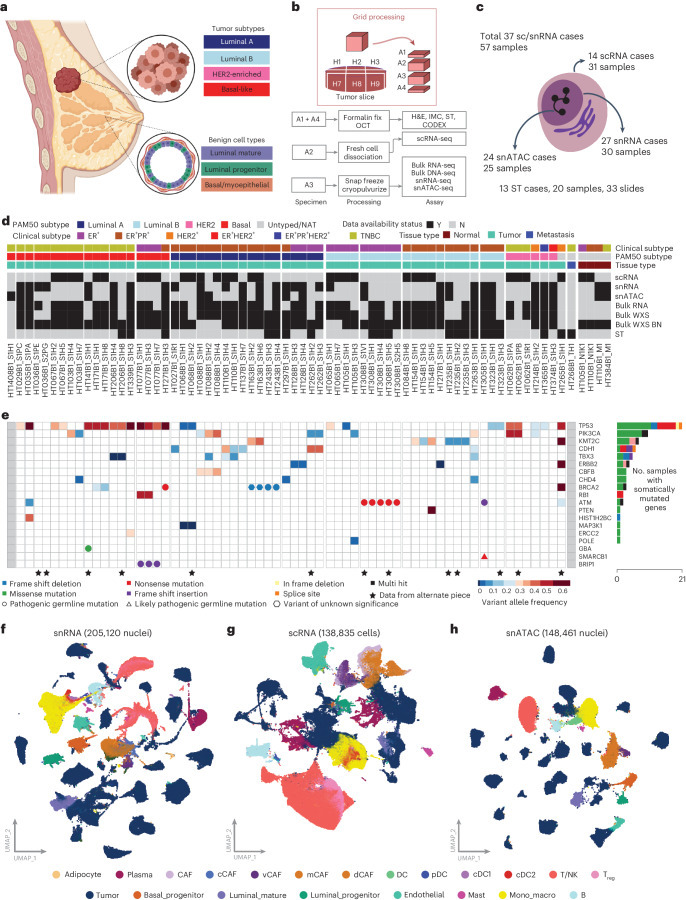
Fig. 1. Study design, data collected and genomic alterations.
a, Summary of benign breast duct cell types and BC subtypes. The image was created with BioRender.com. b, Sample grid processing method utilized in the study to perform various assays on each tumor sample systematically. c, Summary of data types available for single-cell, single-nucleus and ST processing. d, Data overview of the cohort of 61 samples. The N1K1 and M1 suffix denotes normal adjacent tumor samples. Clinical characteristics and data type availability are shown for each tumor piece. Data types include scRNA-seq, snRNA-seq, snATAC-seq, bulk-RNA-seq, ST and bulk WES of tumor and blood normal (BN). e, Genomic landscape of the sample cohort showing the top significantly mutated genes. Color scale in heatmap denotes VAF for each gene. All mutations are somatic, unless indicated by a colored circle/triangle/pentagon designating germline variants of different annotated significance. f, Uniform Manifold Approximation and Projection (UMAP) plots of all cell types for snRNA-seq data colored by cell types. g, UMAP plots of all cell types for single-cell RNA data colored by cell types. h, UMAP plots of all cell types for snATAC-seq data colored by cell types.

