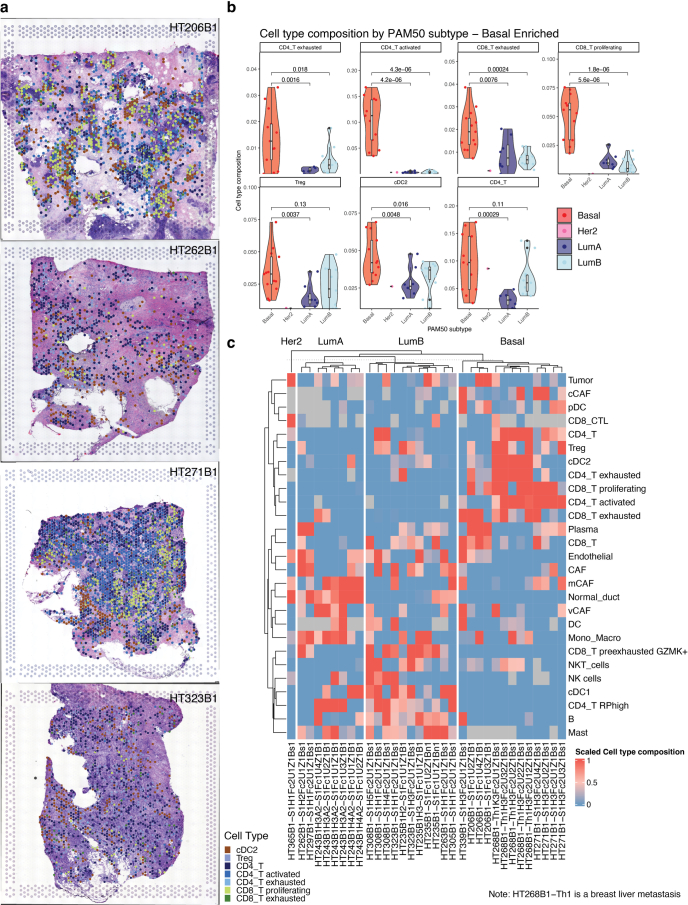
Extended Data Fig. 4. Spatial mapping of snRNA-seq cell types to Spatial Transcriptomics Data using CytoSPACE.
a) CytoSPACE mapping results of CD4, CD8, Treg and cDC2 to a subset of luminal and basal samples. b) Violin plots of cell type composition of basal enriched cell types. Each grouped violin is separated by cell type and subtype. P-values are derived from stat_compare_means using the method = t.test. The boxplots show the median with 1.5 × interquartile range whiskers. For all box-plot sample numbers are as follows: Luminal 19 samples, 8 cases; Basal 13 samples, 4 cases; Her2 1 samples, 1 case. c) The heatmap represents the scaled cell type proportion across all breast spatial transcriptomic samples.

