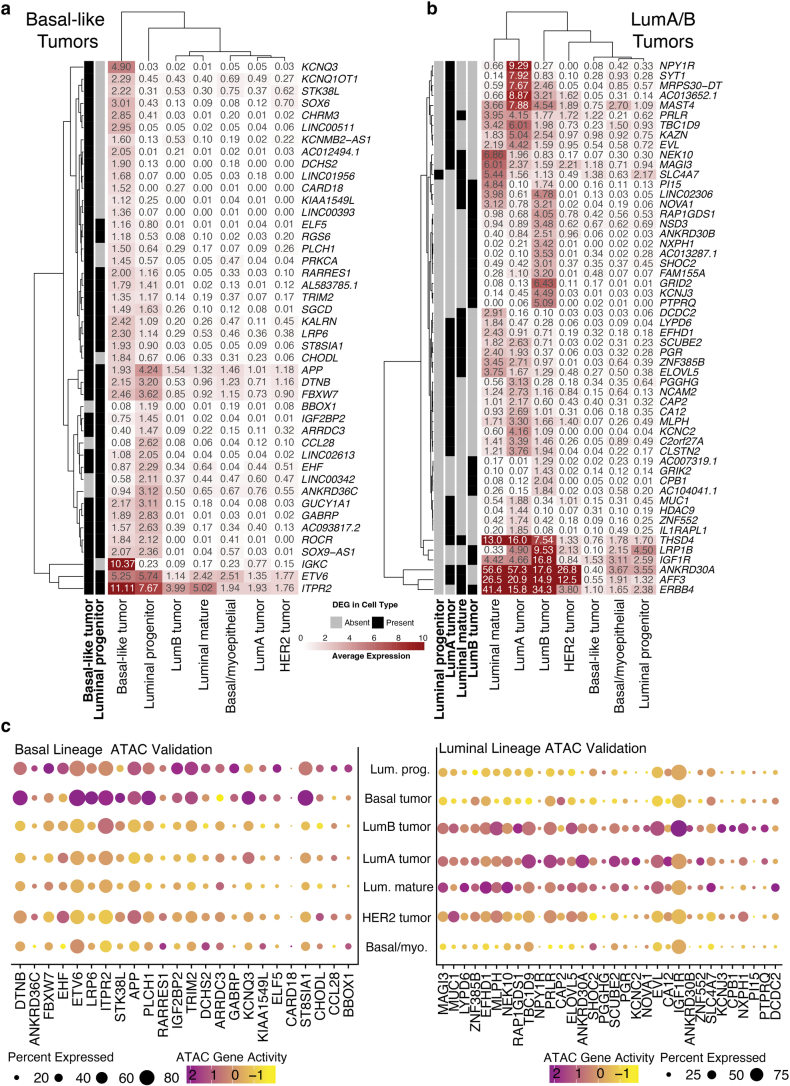
Extended Data Fig. 7. Differential gene expression (DEG) analysis by epithelial lineage.
a) Average expression of differentially expressed genes specific to the basal tumor and/or luminal progenitor cell types. Columns labeled Basal_tumor and Luminal_progenitor indicate whether the gene was identified as a DEG for the respective cell type listed. Heatmap is colored and labeled by average expression of each epithelial cell type for comparison. b) Average expression of differentially expressed genes specific to the Luminal cell types, including: Luminal A tumor, Luminal B tumor, Luminal Mature or Luminal Progenitor. Columns labeled Luminal_progenitor, LumA_tumor, Luminal_mature, LumB_tumor indicate whether the gene was identified as a DEG for the respective cell type listed. Heatmap is colored and labeled by average expression of each epithelial cell type for comparison. c) Dot plot of signac ATAC gene activity values of basal (left) and luminal (right) lineage markers discovered by expression in snRNA-seq data. Data is colored by activity value and size of dot is associated with percent of cells with the associated average gene activity score.

