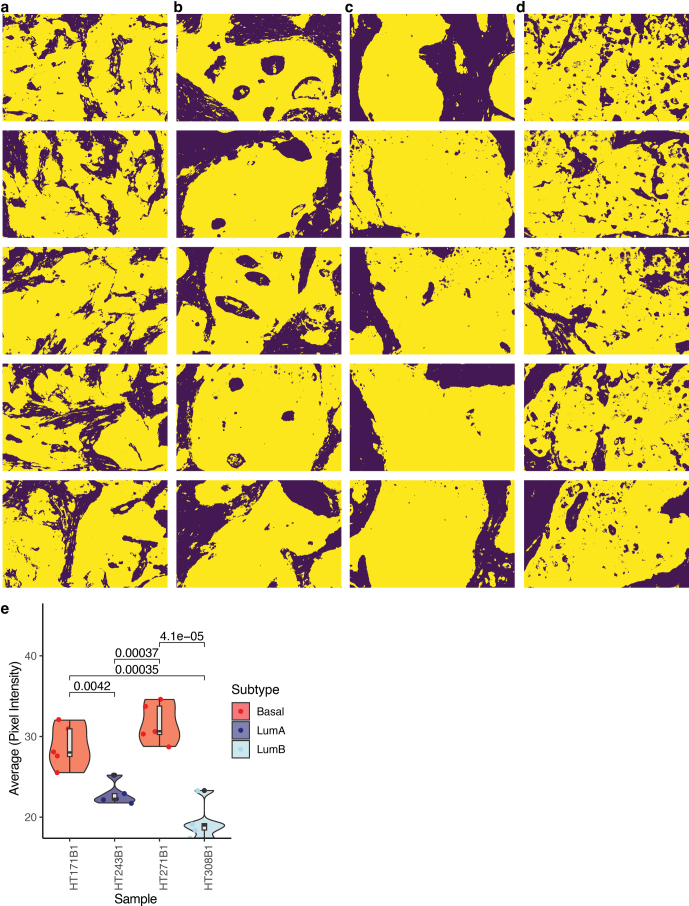
Extended Data Fig. 10. Masks associated with Immunofluorescence images of MELK.
a) Masks of the immunofluorescence (IF) images of 5 representative regions of HT171B1, b) HT243B1, c) HT271B1, and d) HT308B1. One replicate of each is indicated in figures. Masks were generated based on the e-cadherin staining using adaptive thresholding. e) Violin plot of the average pixel intensity of each representative image from the 4 samples. P value indicated comparing the basal samples to luminal samples are derived from stat_compare_means using the method = t.test (two-sided). The boxplots show the median with 1.5 × interquartile range whiskers. For each sample, intensity from 5 regions each are indicated in the box-plot.

