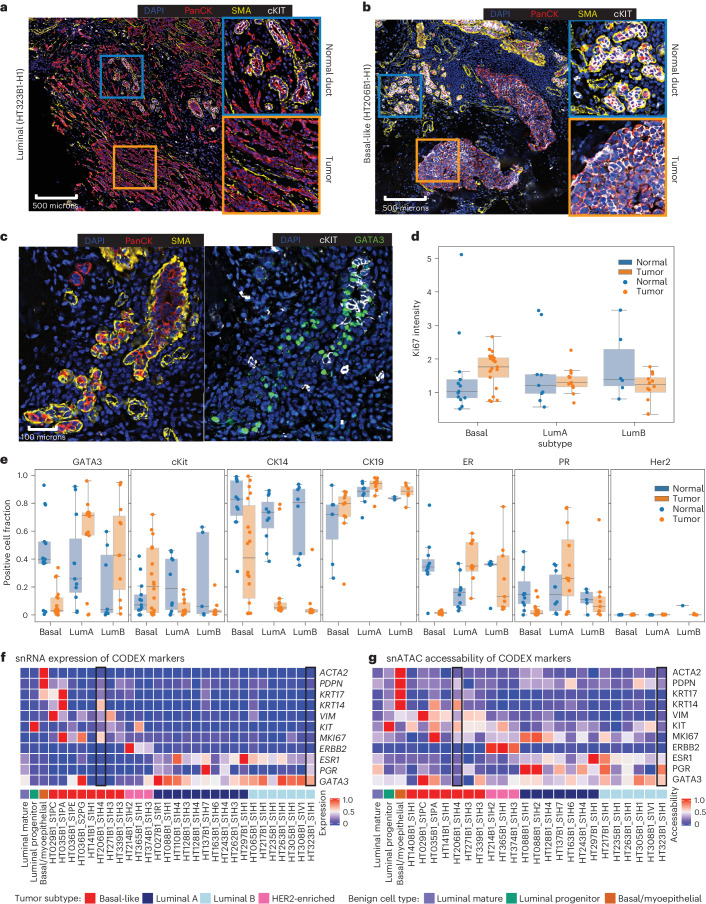
Fig. 5. Spatial characterization of tumor subtype and normal ducts.
a, CODEX multiplex immunofluorescence on luminal sample HT323B1. Inset regions (square) are expanded to the right and colored by related inset. DAPI is stained in blue, PanCK in red, SMA in yellow and c-KIT in white. One replicate indicated in figure. b, CODEX multiplex immunofluorescence on basal sample HT206B1. Inset regions (squares) are expanded to the right and colored by related inset. DAPI is stained in blue, PanCK in red, SMA in yellow and c-KIT in white. One replicate is indicated. c, Section of CODEX immunofluorescence image from HT206B1 centered on a benign ductal region. Section on the left is stained with DAPI in blue, PanCK in red and SMA in yellow. The section on the right is stained with DAPI in blue, c-KIT in white and GATA3 in green. One replicate is indicated. d, Box-plot summarizing overall Ki67 intensity across all samples (49 sections and 21 samples) in normal duct and tumor regions separated by subtype. The box-plots show the median with 1.5 × interquartile range whiskers. e, Positive cell fraction of GATA3 (45 sections and 19 samples), c-Kit (42 sections and 17 samples), CD14 (44 sections and 20 samples), CK19 (27 sections and 8 samples), ER (39 sections and 14 samples), PR (39 sections and 14 samples) and Her2 (33 sections and 9 samples) across all samples in normal duct and tumor regions separated by subtype. f, Average expression scores of CODEX marker genes in the snRNA-seq data. Gene expression for samples HT206B1_S1H1 and HT323B1_S1H1 used for CODEX imaging are outlined. The box-plots show the median with 1.5 × interquartile range whiskers. g, Average chromatin accessibility scores of CODEX marker genes in snATAC-seq data. Chromatin accessibility for samples HT206B1_S1H1 and HT323B1_S1H1 used for CODEX imaging are outlined.

