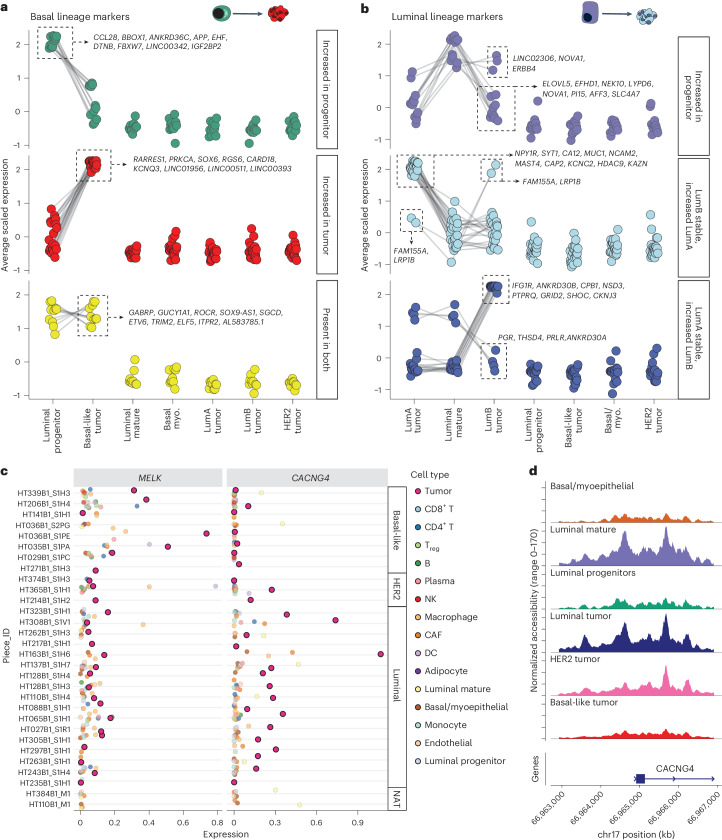
Fig. 7. Differential markers of basal-like and luminal BC lineage.
a, Dot-plots showing average scaled expression of basal-like BC lineage markers. Markers are divided into genes expressed highly in LP cells but not in basal-like BC (top), genes with increased expression in basal-like BC compared to LP cells (middle) and genes high in both groups (bottom). Gene lists are shown for specific groups. b, Dot-plots showing average scaled expression of luminal A/B BC lineage markers. Markers are divided into genes expressed highly in LM cells but not in luminal BC (top), genes with increased expression in luminal A BC compared to LM cells (middle) and genes with increased expression in luminal B BC compared to LM cells (bottom). Dot size indicates average scaled gene expression. Gene lists are shown for specific groups. c, Gene expression across cell types of cell surface tumor-specific markers: MELK identified for basal samples and CACNG4 identified for luminal samples. d, Coverage plot of normalized snATAC-seq chromatin accessibility across the promoter region of CACNG4 for tumor subtypes and benign breast cell types.

