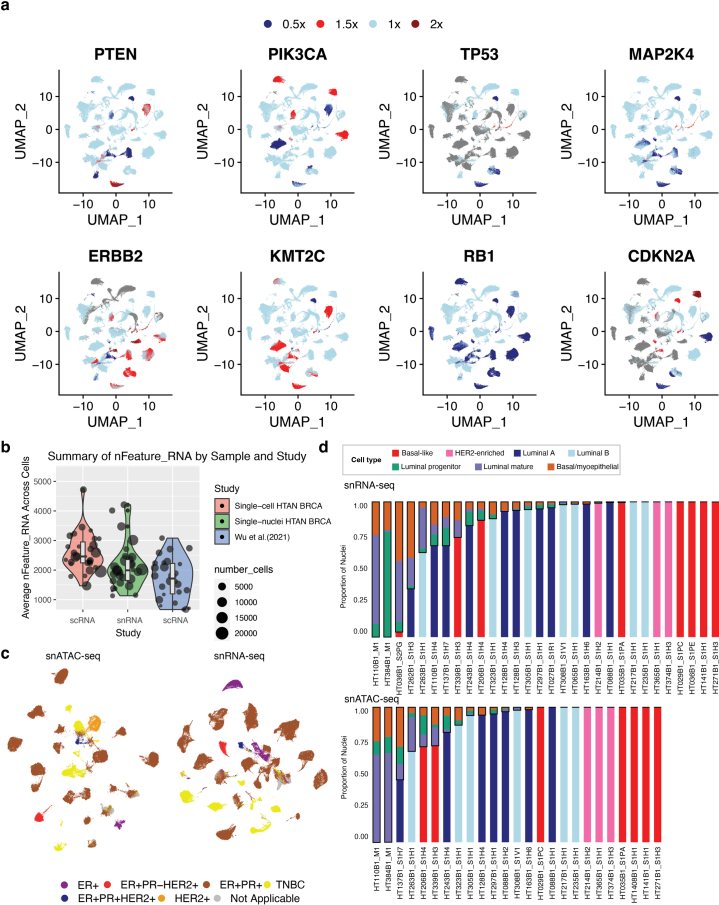
Extended Data Fig. 1. InferCNV, nFeature count and epithelial cell type distribution.
a) UMAP plots of copy number events from inferCNV mapped to epithelial cells derived from snRNA data. b) Violin plot of the average nFeature_RNA detected across each sample across three cohorts (one external dataset Wu et al. 2021 and two internal HTAN cohorts). Size of dots indicate the number of cells detected for each sample and box-plot is overlaid on violin plot (scRNA HTAN BRCA n = 31 samples (from 14 cases), snRNA HTAN BRCA n = 30 samples (from 27 cases), scRNA Wu et al. n = 26 samples). The boxplots show the median with 1.5 × interquartile range whiskers. c) UMAP representations of epithelial subsets for snATAC and snRNA samples colored by clinical subtype. d) (Left) Barplots indicating proportion of epithelial nuclei per sample identified for the snRNA-seq data. (Right) Barplots indicating proportion of epithelial nuclei per sample identified for the snATAC-seq data.

