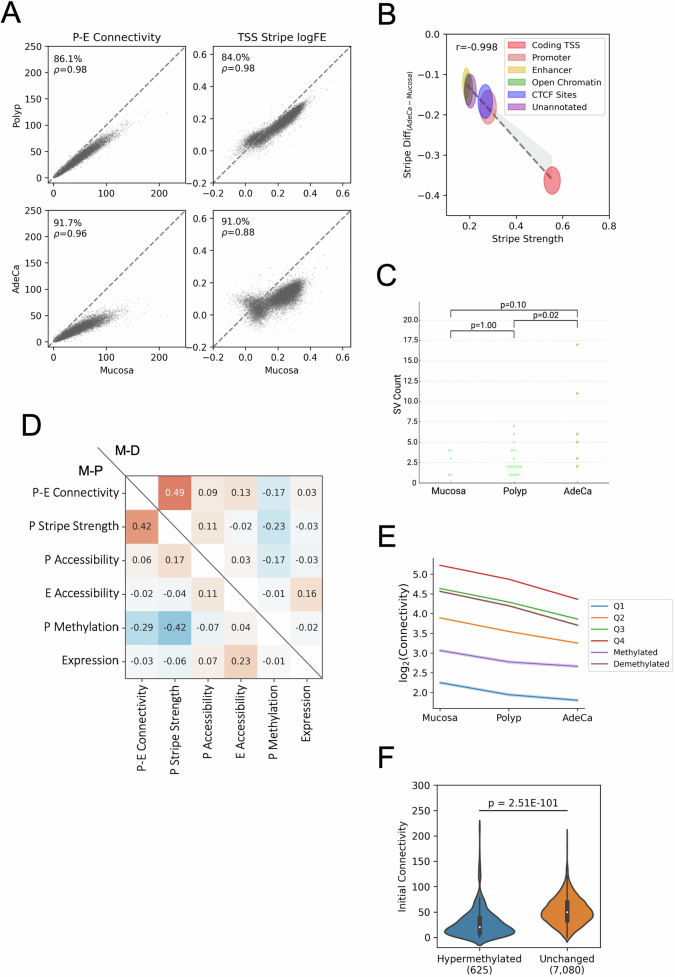
Extended Data Fig. 5. Dynamics of P-E connectivity through colorectal cancer (CRC) progression.
(a) Scatter plots depicting the comparative analysis of P-E connectivity and TSS stripe strengths across different CRC stages. The percentage of genes with reduced connectivity (y < x) during progression is indicated for each stage comparison. (b) Correlation between initial stripe strength in mucosa samples and the extent of stripe reduction in adenocarcinoma samples. Each ellipse’s center and radius represent the mean and standard deviation, respectively, for stripes associated with the specified regulatory elements. The dotted line shows the linear regression across the centers of the ellipses. (c) Distribution of SV counts in samples. Significance p values of count differences stages from Mann–Whitney U test are indicated. (d) Spearman correlation matrix detailing the changes (log2 fold change, FC) of structural and epigenetic features between polyps (M-P) and adenocarcinoma (M-D) relative to unaffected mucosa. (e) Average log2 fold change in P-E connectivity for polyps and adenocarcinoma, categorized by promoter methylation status: quantiles (Q1-Q4), demethylated, and methylated, excluding those with minimal hypo- or hyper-methylation. Confidence intervals are depicted as shaded areas behind each line. (f) Distribution of P-E connectivity in mucosa samples for gene promoters that become hypermethylated (N = 625) or remain unchanged (N = 7,080) in adenocarcinoma. The significance of differences (p = 2.51E-101) is tested using the Mann-Whitney U test.

