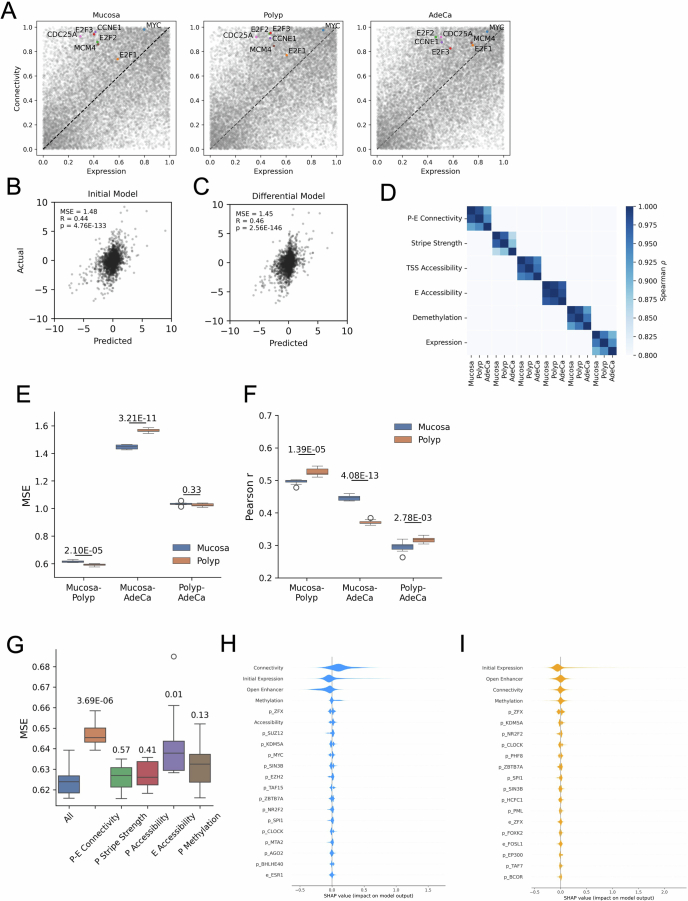
Extended Data Fig. 7. Predictive modeling of gene expression changes based on promoter-enhancer (P-E) connectivity.
(a) Distributions of ranks for P-E connectivity and corresponding gene expression levels of key oncogenes and proliferation markers across various cancer progression stages. (b) Model fit assessment for the predicted changes in gene expression in adenocarcinoma using the ‘initial’ model, which utilizes the baseline P-E connectivity. (c) Model fit assessment for the predicted changes in gene expression in adenocarcinoma using the ‘differential’ model, which considers changes in epigenetic landscapes. (d) Spearman correlation matrix showing the similarity of each feature between different stages. (e) Mean squared error (MSE) and (f) Pearson’s r coefficient of the ‘initial’ model for the prediction of gene expression changes in adenocarcinoma compared to the indicated baseline stages. Prediction scores obtained by models trained with mucosa and polyp datasets were compared by using independent t test (N = 10 random initiation states). For mean square error (MSE), p = 2.10E-5, p = 3.21E-11, and p = 0.33; for Pearson’s r, p = 1.39E-5, p = 4.08E-13, and p = 2.78E-3, for mucosa-polyp, mucosa-AdeCa, and polyp-AdeCa prediction models, respectively. (g) Distributions of minimal mean square error (MSE) of ‘Initial’ model trained with equal or less than 20 epochs (N = 10 random initiation states) with the removal of indicated features. Significance p values of differential MSE caused by missing features compared to complete model (All) are evaluated by using independent t-test. Respectively, p = 3.69E-6, p = 0.57, p = 0.41, p = 0.01, and p = 0.03 for models removing P-E connectivity, P stripe strength, P accessibility, E accessibility, and P methylation feature. (h) The top 20 influential features impacting gene expression predictions in adenocarcinoma, as determined by SHAP (SHapley Additive exPlanations) analysis for the ‘initial’ model. (i) The top 20 influential features for the ‘differential’ polyp model, with features named after transcription factors indicating their binding presence at the promoter (p) or enhancer (e) regions, based on the ENCODE database.

