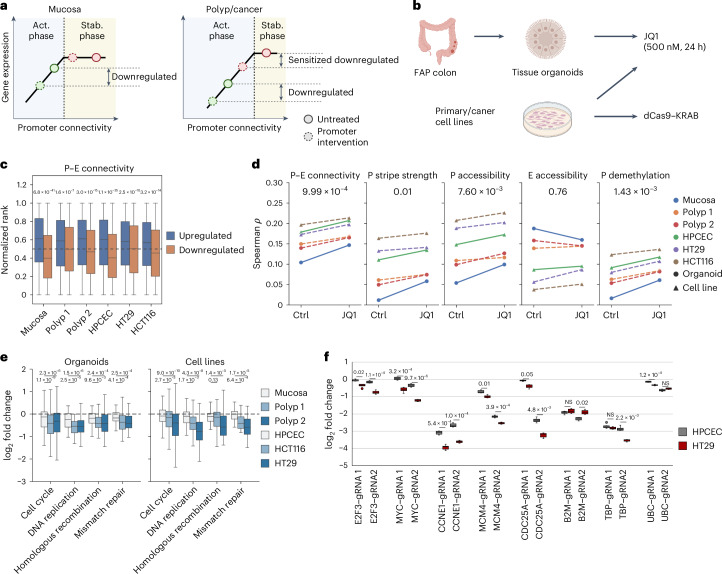
Fig. 5. Two-phase model predicts gene- and polyp/cancer-specific sensitivity to inhibitions.
a, Schematic representing the prediction model. Low-connectivity genes (green dots) are vulnerable to perturbations in the activation phase, independent of overall connectivity levels. Conversely, genes with high connectivity exhibit stage-specific sensitivity to perturbations as they approach the phase transition threshold because of connectivity loss. b, Diagram of experimental designs for assessing gene expression sensitivity to various interventions. c, Comparisons of distribution of P–E connectivity levels in unaffected mucosa for genes upregulated (n = 5,504) or downregulated (n = 7,028) after JQ1 treatment of samples. P values for significance were determined by the Mann–Whitney U-test. Organoid (mucosa), P = 6.8 × 10−41; organoid (polyp 1), P = 1.6 × 10⁻⁷; organoid (polyp 2), P = 3.0 × 10⁻¹⁶; HPCEC, P = 1.1 × 10⁻³⁵; HT29, P = 2.5 × 10⁻¹⁰; HCT16, P = 3.2 × 10⁻¹⁴. d, Spearman correlation between structural and epigenetic features in mucosa and gene expression levels in cell lines and organoids before and after JQ1 treatment. P values for significance from the Wilcoxon signed-rank test are indicated. P–E connectivity, P = 9.99 × 10⁻⁴; promoter stripe strength, P = 0.01; promoter accessibility, P = 7.60 × 10⁻³; enhancer accessibility, P = 0.76; promoter demethylation, P = 1.43 × 10⁻³. e, Expression fold change distributions for genes (n = 205) in specified pathways following JQ1 treatment. P values for sample differential responses from the Wilcoxon signed-rank test are denoted. Respective P values for comparisons between mucosa organoid and two polyps: 1.1 × 10⁻⁹ and 2.3 × 10⁻⁶ for cell cycle, 2.5 × 10⁻⁵ and 1.5 × 10⁻⁶ for DNA replication, 9.6 × 10⁻³ and 2.4 × 10⁻⁴ for homologous recombination and 4.1 × 10⁻⁴ and 2.5 × 10⁻⁴ for mismatch repair. Respective P values for comparisons between HPCEC and HT29/HCT116 cell lines: 2.7 × 10⁻³ and 9.0 × 10⁻¹⁰ for cell cycle, 1.7 × 10⁻³ and 4.3 × 10⁻⁸ for DNA replication, 0.13 and 1.4 × 10⁻⁵ for homologous recombination and 6.4 × 10⁻⁴ and 1.7 × 10⁻⁵ for mismatch repair. f, Differential gene expression following Cas9–KRAB-mediated repression using two gRNAs in primary human colon epithelial cells (HPCEC) and the HT29 colorectal adenocarcinoma cell line. Measurements were repeated for cells cultured separately (n = 8). The significance of differential responses was assessed by a two-sample t-test followed by Bonferroni correction. Respective adjusted P values for gRNA1 and gRNA2: 0.02 and 1.1 × 10⁻⁴ for E2F3, 3.2 × 10⁻⁴ and 9.6 × 10⁻⁶ for MYC, 5.4 × 10⁻⁴ and 1.0 × 10⁻⁴ for CCNE1, 0.01 and 3.9 × 10⁻⁴ for MCM4, 0.05 and 4.8 × 10⁻³ for CDC25A, NS and 0.02 for B2M, NS and 2.2 × 10⁻³ for TBP and 1.2 × 10⁻⁴ and NS for UBC.

