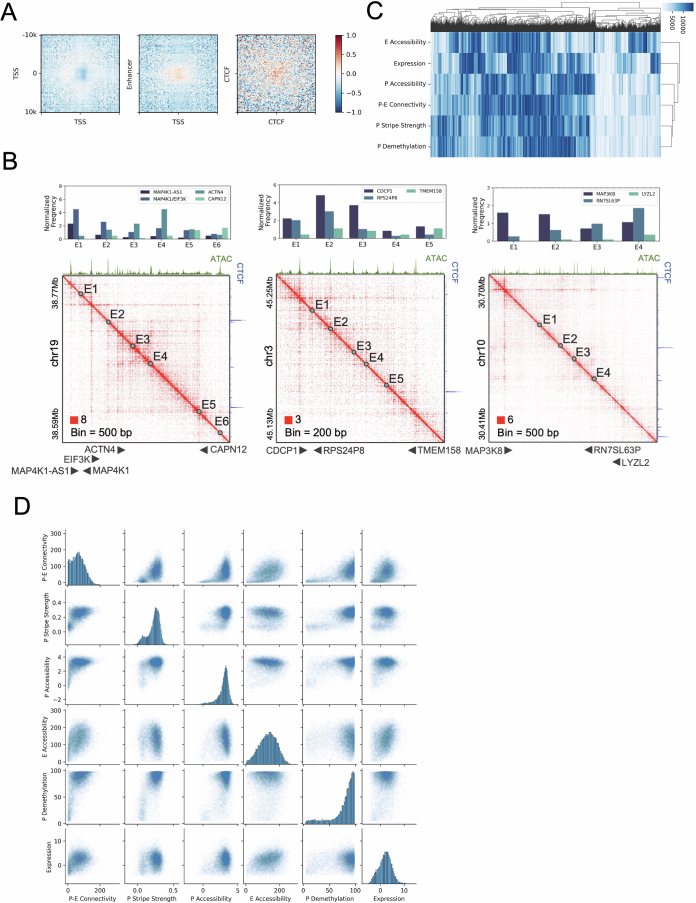
Extended Data Fig. 4. Analysis of the interplay between structural features and epigenetic markers.
(a) Heatmaps displaying loop signal intensities as referred to in Fig. 2a, adjusted for the effects of stripe strengths at the loop anchors. (b) Contact heatmap at example loci where gene promoters lacking CTCF binding display gene-specific P-E interactions. (c) Hierarchical clustering of genes based on their rankings for various structural and epigenetic features in mucosa samples. Intensity of color corresponds to the strength of the features. (d) Comparative scatter plots illustrating the relationships between different structural and epigenetic features across the examined dataset.

