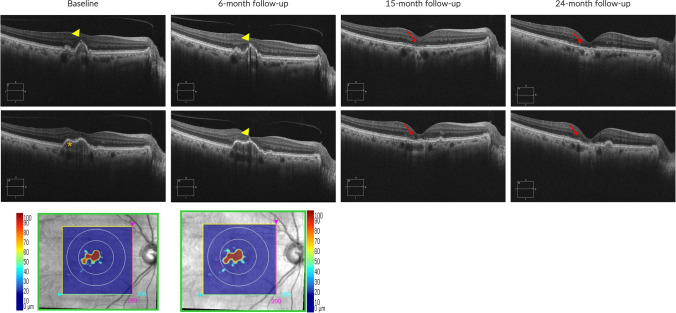
Fig. 2.
Structural OCT images from a patient with intermediate AMD developing GA. Baseline and 6-month follow-up structural OCT images revealed imaging biomarkers indicative of GA development. These biomarkers included hyperreflective foci (indicated by a yellow arrowhead) and a substantial drusen volume (denoted by an orange asterisk). The Cirrus 6000 OCT device (Zeiss, Dublin, CA) automatically measured the drusen map volume (bottom line), highlighting a noticeable growth in drusen volume over the 6-month period (from 0.12 mm3 to 0.15 mm3) in the 3-mm central circle. By the 15-month follow-up, the emergence of cRORA became evident, with a further enlargement of the atrophic area observed at the 24-month follow-up visit

