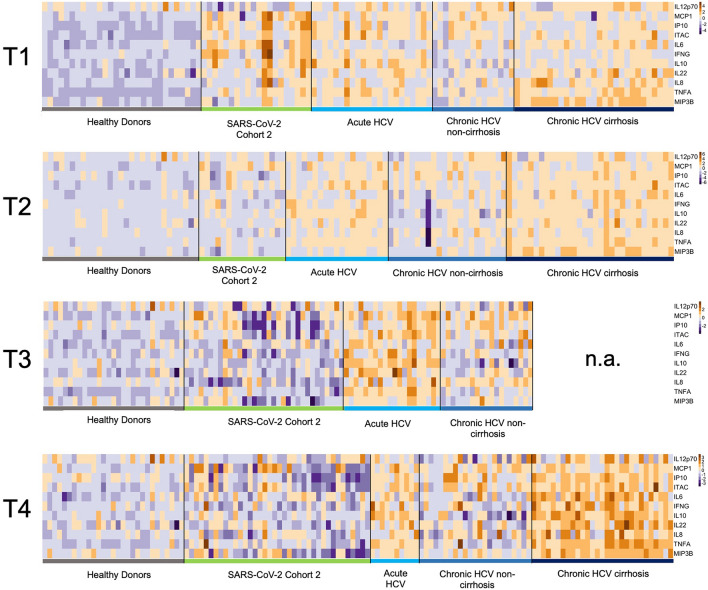
Fig. 1.
Soluble inflammatory mediators (SIM) over time in SARS-CoV-2 and HCV cohorts. A logarithmic scale heatmap illustrating the concentrations of individual cytokines and chemokines relative to the corresponding median concentrations at different time points (T1-4). Dark blue represents decreased SIM concentrations, while dark brown indicates increased SIM concentrations. Healthy donor levels at T1 are maintained across all time points. T1 corresponds to baseline (start of therapy/positive PCR result), T2 = 3 months, T3 = 6 months, and T4 = 9 months. Notably, data for the long-term follow-up (T5) are presented for the chronic HCV cohort with cirrhosis, as T4 data is missing.

