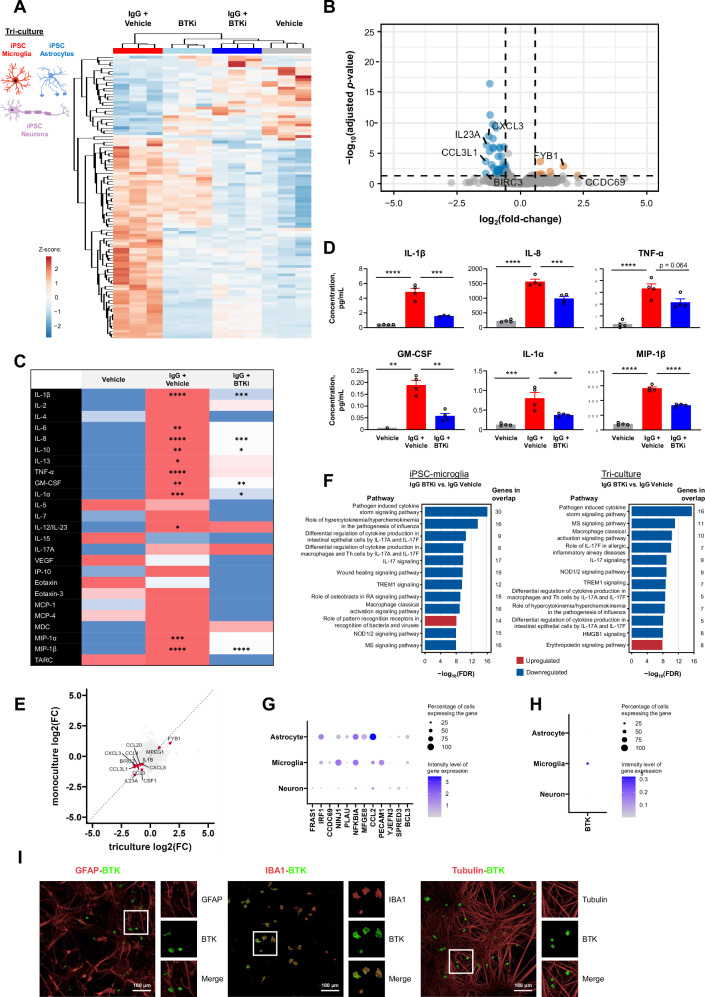
Fig. 5. Identification of a BTK-dependent transcriptional signature in a human iPSC-derived tri-culture of microglia, astrocytes, and neurons.
A, B Tolebrutinib-specific transcriptomic signature in human tri-culture, 6 h after complexed IgG stimulation (10 μg/mL Fc OxyBURST™; Invitrogen, F2902). Heatmap of DESeq2 normalized counts scaled using a Z-score for the top 100 differentially expressed genes between IgG + tolebrutinib and IgG + vehicle, as ranked by p-value (A). Volcano plot of differential expression between IgG + tolebrutinib and IgG + vehicle. Differential expression analysis was performed using DESeq2. 396 genes were observed to be differentially regulated in the IgG + tolebrutinib condition (absolute(fold-change) ≥1.5 and FDR ≤ 0.05) (Wald significance test implemented in DESeq2). The 14 most strongly up- and down-regulated genes (as ranked by log2(fold-change)) are labeled (B). C Effect of tolebrutinib on cytokine and chemokine secretion in human tri-culture, 24 h after IgG stimulation, as assessed using multiplex panels. Comparisons are for IgG + vehicle vs. vehicle, and for IgG + tolebrutinib vs. IgG + vehicle. Shown p-values were calculated using one-way ANOVA with post hoc Sidak test. D Cytokine and chemokine secretion: analytes that were induced by IgG and blocked by tolebrutinib, significance indicated in (C) (n = 1–4 technical replicates). E Four-way plot of triculture differential expression results for IgG + tolebrutinib vs IgG (Fig. 5B) and hiPSC-derived microglia monoculture differential expression results for IgG + tolebrutinib vs IgG (Fig. 4B). Labeled genes were commonly significantly differentially expressed genes between the two analyses (for triculture, absolute(fold-change) ≥1.5 and FDR ≤ 0.05; for monoculture, absolute(fold-change) ≥1.5 and FDR ≤ 0.05). F IPA pathway analysis for the IgG + olebrutinib vs IgG comparison in human hiPSC-derived microglia, left, and human tri-culture, right. The 12 pathways that had the strongest significance levels (−log10(FDR)) and showed direction (negative z-score [predicted inhibition] or positive z-score [predicted activation]) are presented. The pathway analysis gene list for hiPSC-derived microglia is the tolebrutinib-dependent transcriptional signature identified in Fig. 4B. The gene list for tri-cultures is the tolebrutinib-dependent transcriptional signature identified in Fig. 5B. G Expression of BTK-regulated gene targets in the tri-culture. H Cellular enrichment of BTK expression in the tri-culture, with BTK transcripts identified in 30.5, 0.9, and 0.9 percent of microglia, astrocytes, and neurons, respectively, with Seurat normalized average expression levels of 0.376, 0.004, and 0.007. I Fluorescent immunostaining for markers of astrocytes (GFAP), microglia (IBA1), and neurons (beta-III tubulin) in the tri-culture. This experiment was reproduced twice with similar results. P-values are indicated by * ≤ 0.05, ** ≤ 0.01, *** ≤ 0.001, and **** ≤ 0.0001. Data are presented as mean values ± SEM. BTK Bruton’s tyrosine kinase, FDR false discovery rate, GFAP glial fibrillary acidic protein, GM-CSF granulocyte-macrophage colony-stimulating factor, HMGB1 high mobility group box 1, IBA1 ionized calcium-binding adapter molecule 1, IgG immunoglobulin G, IL interleukin, IP-10 interferon gamma-induced protein 10, IPA ingenuity pathway analysis, hiPSC human induced pluripotent stem cell, MCP monocyte chemoattractant protein, MDC macrophage-derived chemokine, MIP macrophage inflammatory protein, MS multiple sclerosis, NOD nucleotide oligomerization domain, RA rheumatoid arthritis, TARC thymus and activated-regulated chemokine, Th T helper, TNF tumor necrosis factor, VEGF vascular endothelial growth factor. Source data are provided as a Source Data file.

