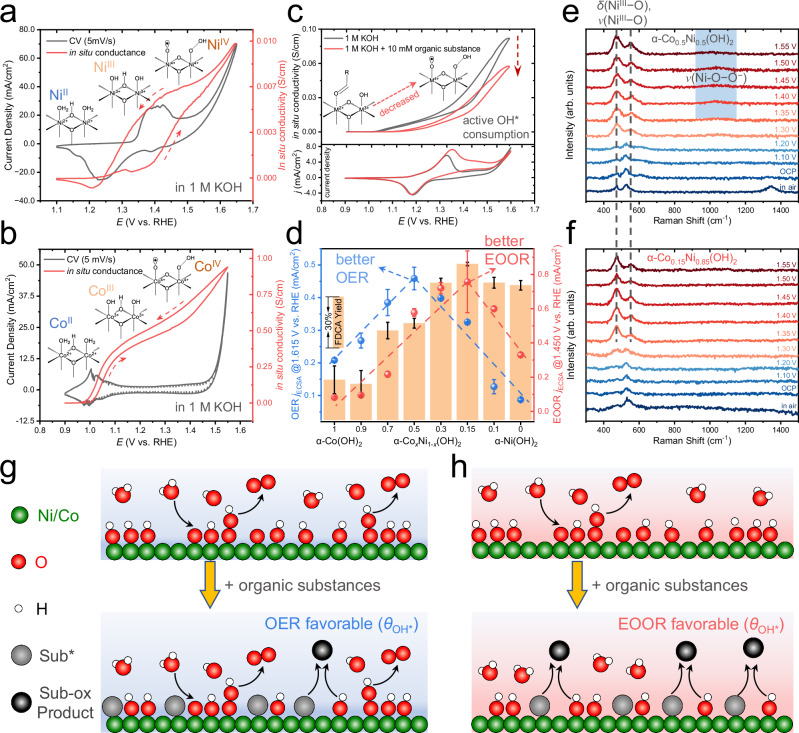
Fig. 2. The in situ measurements of α-CoxNi1-x(OH)2 reveal the active oxygenated species generation and their consumption by organics.
On-chip CV and in situ electrical transport (ETS) signals of α-Ni(OH)2 (a), α-Co(OH)2 (b) in 1.0 M Fe-free KOH with a slow scan rate (5 mV/s) of electrochemical potential. The red dashed arrows indicate the potential scan direction. c The typical ETS signals obtained in 1.0 M KOH and with the addition of 10 mM organic substance (HMF, 5-hydroxymethylfurfural) for α-Co0.5Ni0.5(OH)2 (upper part) and its CV curves in the condition of OER and EOOR (bottom part). The arrow indicates the decreased in situ conductivity due to OH* consumption. d The catalytic activities (normalized by roughness factor) of OER and EOOR of different α-CoxNi1-x(OH)2 (x = 0–1), where two sets of volcano-like correlations (guided by dashed blue and red lines) can be observed. The yield of FDCA (2,5-furandicarboxylic acid) products (orange column) in bulk electrolysis is also presented. Error bars were obtained from three independent electro-organic oxidation reactions. All electrochemical data were presented without iR-correction. The size of carbon papers (C.P.) were 1 × 2 cm2. The in situ Raman spectroscopy characterizations of α-Co0.5Ni0.5(OH)2 (e) and α-Co0.15Ni0.85(OH)2 (f) during EOOR, where the δ(NiIII−O) (~480 cm−1), υ(NiIII−O) (~550 cm−1) and O−O− peak (~1060 cm−1) are labeled in dashed lines and blue rectangles, respectively. g, h Schematic illustration of surface processes and the characteristic change in surface OH* coverage on the catalysts that favor OER and EOOR pathway, respectively. The green, red, white, gray, and black circles represent Ni/Co, O, H, adsorbed substance, and oxidized products, respectively.

