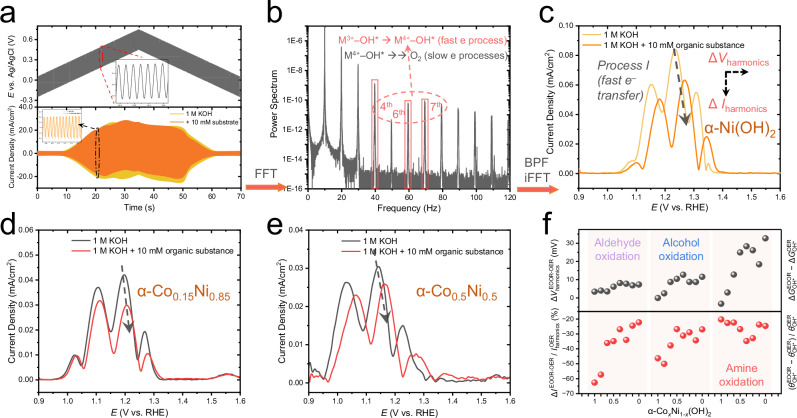
Fig. 3. The principle and results of the FTacV measurements on OER and EOOR.
a The applied electrochemical potential (d.c. + a.c.) and collected overall currents. b The power spectrum of overall current processed after fast Fourier transformation (FFT) and the target harmonics (marked by a red box and a dashed arrow) filtered by a band pass filter (BPF) followed with inverse FFT (iFFT) algorithms. c The ΔIharmonics and ΔVharmonics parameters extracted from the harmonics of α-Ni(OH)2. The FTacV harmonic responses for α-Co0.15Ni0.85(OH)2 (d) and α-Co0.5Ni0.5(OH)2 (e) in 1.0 M KOH and the addition of 10 mM organic substances (benzylamine). Here both the absolute values of peak currents and the peak potentials (Process I) change, as labeled by dashed arrows, indicating the varied θM(3+δ)−OH* and ΔGOH*. All electrochemical data were presented without iR-correction. The size of carbon papers (C.P.) was 1 × 2 cm2. f Summarized values of the two physio-chemical descriptors ( and ) in the electro-oxidation of aldehyde (furfural), alcohol (furfuryl alcohol), and amie (benzylamine).

