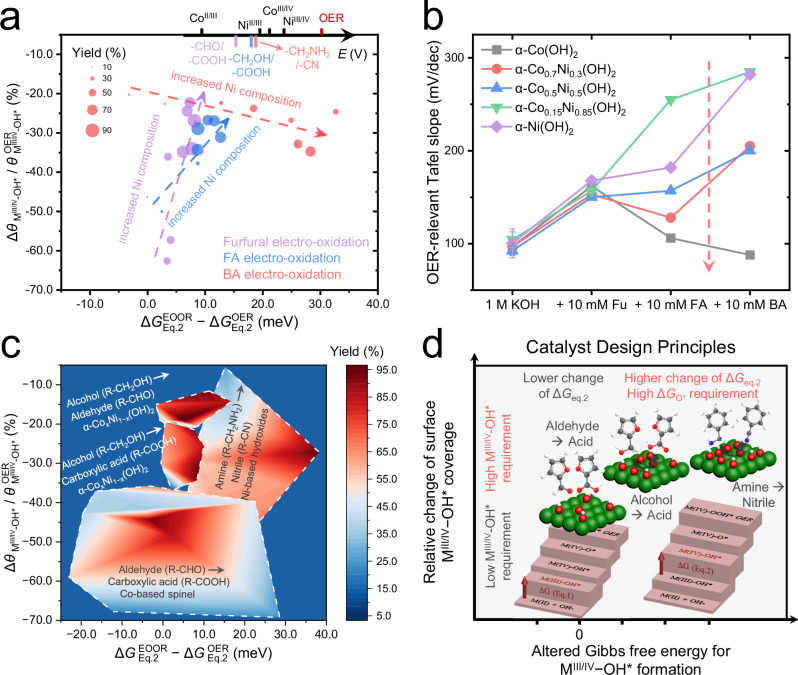
Fig. 5. The summarized catalytic activity diagrams for EOORs, using two operando physio-chemical descriptors.
The summarized catalytic activity diagrams for three EOORs catalyzed by α-CoxNi1-x(OH)2 (a) and four catalyst systems (c). The experimentally measured oxidation potential sequence of transition mental sites and organic substances in 1 M KOH is presented in the top axis of (a). b The OER-relevant Tafel slopes derived in the kinetic Tafel region (at the potential range of 1.5−1.6 VRHE, where the FEOER > 80%). “Fu”, “FA” and, “BA” represent furfural, furfuryl alcohol and benzylamine, respectively. Error bars were obtained from three independent experiments. The dashed arrows indicate the decreased OER-relevant Tafel slopes in the case of alcohol and amine oxidation from high Ni contents to high Co contents. d The catalysts design principles for the efficient organics electro-oxidation. The red arrows indicate the altered free energy steps during EOOR. The green, red, white, and gray balls represent the metal site, oxygen, hydrogen atoms, and the carbon atoms in different substances, respectively.

