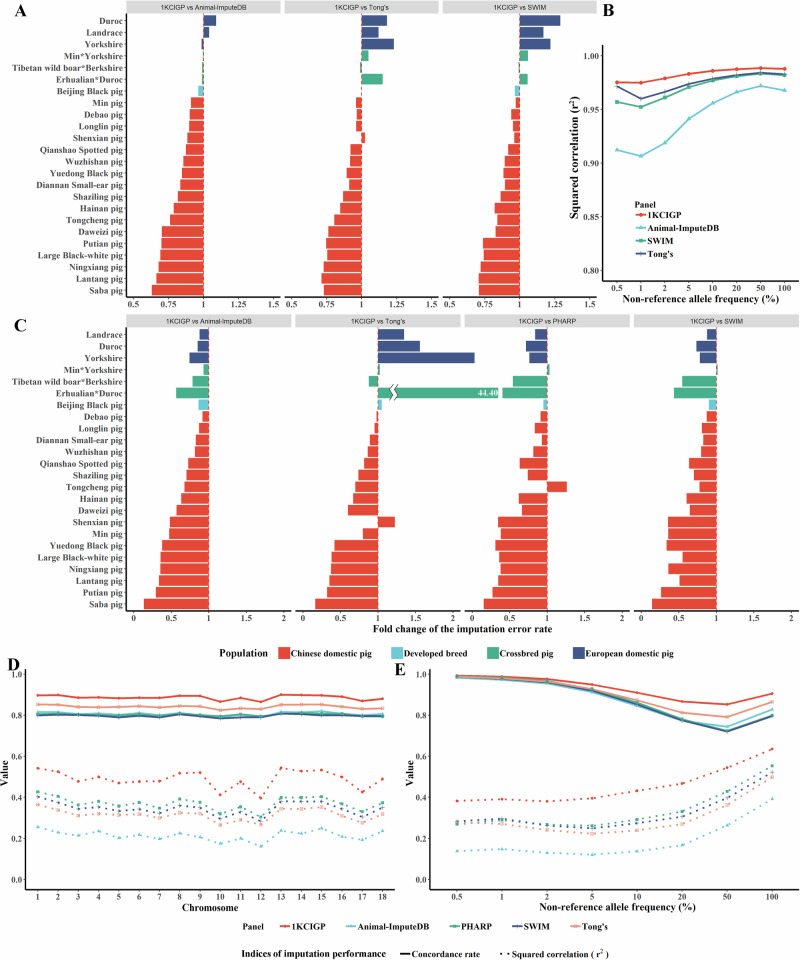
Fig. 2. Performance of the 1KCIGP haplotype reference panel.
A The fold-change in the imputation error rate in the 262 test WGS data using the 1KCIGP, Animal-ImputeDB, SWIM, and Tong’s reference panels. Imputation error rate = (1 – imputation concordance rate). The different colored bars represent different populations, corresponding to the populations shown in Fig. 2C. B The squared correlation between the imputed allele dosages and the true genotype within the stratified non-reference allele frequency bins was derived from the 113 test WGS data of Chinese domestic pigs using the 1KCIGP, Animal-ImputeDB, SWIM, and Tong’s reference panels. C Fold change in imputation error rate in the simulated commercial 50 K SNP chip using the 1KCIGP, Animal-ImputeDB, SWIM, PHARP, and Tong’s reference panels. Imputation error rate = (1 – imputation concordance rate). D Imputation performance of each chromosome from the simulated commercial 50 K SNP chip of Chinese domestic pigs using the 1KCIGP, Animal-ImputeDB, SWIM, PHARP, and Tong’s reference panels. This and subsequent scenarios only display results for the Chinese domestic pig. The solid line represents the concordance rate, while the dashed line represents the squared correlation. Different colors represent different panels. E The imputation performance within stratified non-reference allele frequency bins derived from the simulated commercial 50 K SNP chip data of Chinese domestic pigs using the 1KCIGP, Animal-ImputeDB, SWIM, PHARP, and Tong’s reference panels.

